Flexenable has a total of 886 patents globally, out of which 517 have been granted. Of these 886 patents, more than 35% patents are active. United States of America is where Flexenable has filed the maximum number of patents, followed by United Kingdom and Germany. Parallelly, United Kingdom seems to be the main focused R&D centre and also is the origin country of Flexenable.
Flexenable was founded in the year 2015. The Company develops, manufactures and distributes plastic electronic products. The Company provides electrophoretic and flexible plastic display products.
Do read about some of the most popular patents of Flexenable which have been covered by us in this article and also you can find Flexenable patents information, the worldwide patent filing activity and its patent filing trend over the years, and many other stats over Flexenable patent portfolio.
How many patents does the CEO of Flexenable have?
The CEO Chuck Milligan has 13 patents.
How many patents does Flexenable have?
Flexenable has a total of 886 patents globally. These patents belong to 290 unique patent families. Out of 886 patents, 313 patents are active.
How Many Patents did Flexenable File Every Year?

Are you wondering why there is a drop in patent filing for the last two years? It is because a patent application can take up to 18 months to get published. Certainly, it doesn’t suggest a decrease in the patent filing.
| Year of Patents Filing or Grant | Flexenable Applications Filed | Flexenable Patents Granted |
| 2023 | 4 | 17 |
| 2022 | 2 | 28 |
| 2021 | 13 | 16 |
| 2020 | 68 | 43 |
| 2019 | 68 | 46 |
| 2018 | 66 | 49 |
| 2017 | 35 | 51 |
| 2016 | 35 | 36 |
| 2015 | 44 | 38 |
| 2014 | 52 | 32 |
| 2013 | 65 | 36 |
| 2012 | 42 | 29 |
How many Flexenable patents are Alive/Dead?

How Many Patents did Flexenable File in Different Countries?

Countries in which Flexenable Filed Patents
| Country | Patents |
| United States Of America | 240 |
| United Kingdom | 180 |
| Germany | 122 |
| Europe | 88 |
| Taiwan | 56 |
| Austria | 42 |
| Russia | 34 |
| China | 33 |
| Korea (South) | 28 |
| Canada | 6 |
| Australia | 5 |
| Singapore | 5 |
| Brazil | 4 |
Where are Research Centres of Flexenable Patents Located?

10 Best Flexenable Patents
US6723394B1 is the most popular patent in the Flexenable portfolio. It has received 380 citations so far from companies like Plastic Logic Limited, Sony Corporation and Merck Patent.
Below is the list of 10 most cited patents of Flexenable:
| Publication Number | Citation Count |
| US6723394B1 | 380 |
| USD674402S1 | 88 |
| US20150277496A1 | 87 |
| US20160014882A1 | 82 |
| US8610988B2 | 80 |
| US6905906B2 | 71 |
| US7176040B2 | 62 |
| USD603398S1 | 58 |
| US20150198978A1 | 48 |
| US6808972B2 | 46 |
How many inventions of other companies were rejected due to Flexenable patents?
The statistics below share strategic R&D insights. It tells the companies that were trying to protect inventions similar to Flexenable invention. They couldn’t because Flexenable had protected those before them.
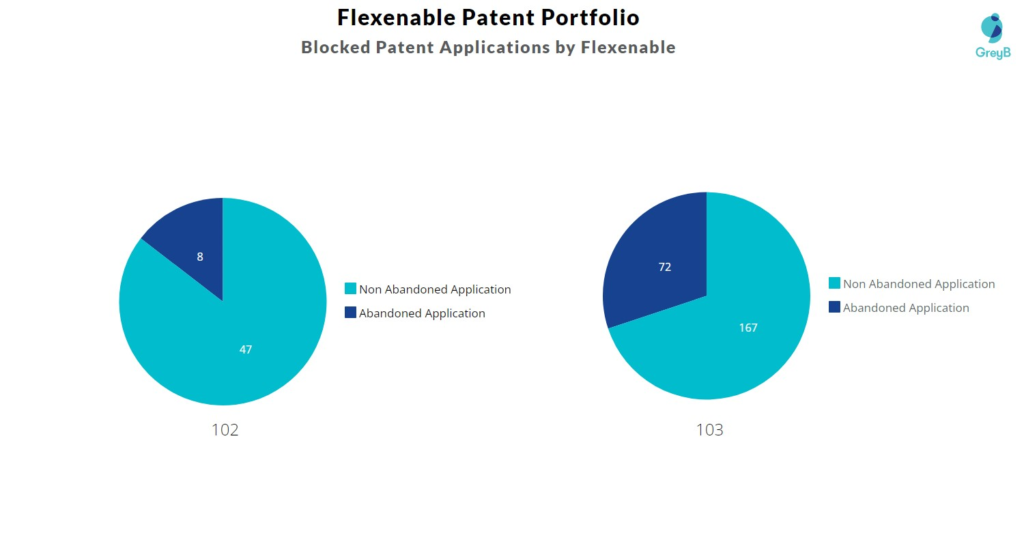
Examiners at the USPTO referred 87 Flexenable patents in 562 rejections (35 USC § 102 or 35 USC § 103 types).
The top citing companies in the Flexenable patent portfolio are Samsung, Semiconductor Energy Laboratory and Merck Patent.
List of the Companies whose Patents were rejected citing Flexenable –
| Company | Number of Patent Applications that faced Rejection Citing Flexenable Patents | Number of Rejections (102 & 103) |
| Samsung | 27 | 47 |
| Semiconductor Energy Laboratory | 11 | 23 |
| Merck Patent | 7 | 19 |
| Boe Technology | 7 | 11 |
| Lg Display | 7 | 11 |
| Sony Corporation | 7 | 21 |
| Sharp Kabushiki Kaisha | 6 | 8 |
| Fujifilm | 6 | 11 |
| Epson | 5 | 5 |
| Parc | 4 | 8 |
Count of 102 and 103 Type Rejections based on Flexenable Patents

Top Flexenable Patents used in Rejecting Most Patent Applications
| Patent Number | Count of Rejected Applications |
| US8619021B2 | 16 |
| US8451249B2 | 14 |
| US9229600B2 | 13 |
| US7920320B2 | 11 |
| US20150277496A1 | 10 |
| US8539341B2 | 8 |
| US20120306811A1 | 7 |
| US20160014882A1 | 7 |
| US8986793B2 | 7 |
| US6905906B2 | 7 |
| US7718734B2 | 6 |
| US7407849B2 | 5 |
| US8987808B2 | 5 |
| US8462124B2 | 5 |
| US10340457B2 | 4 |
What Percentage of Flexenable US Patent Applications were Granted?
Flexenable (Excluding its subsidiaries) has filed 175 patent applications at USPTO so far (Excluding Design and PCT applications). Out of these 125 have been granted leading to a grant rate of 73.96%.
Below are the key stats of Flexenable patent prosecution at the USPTO.

Which Law Firms Filed Most US Patents for Flexenable?
| Law Firm | Total Applications | Success Rate |
| Sughrue Mion | 82 | 76.83% |
| Knobbe Martens Olson & Bear | 39 | 82.05% |
| Dergosits & Noah | 27 | 52.17% |
| Fish & Richardson | 8 | 100.00% |
| Tarolli Sundheim Covell & Tummino | 7 | 16.67% |
| Hamilton Descanctis & Cha General | 3 | 66.67% |
| Schwegman Lundberg & Woessner | 2 | 100.00% |
| Snell & Wilmer | 2 | 100.00% |
| E Ink Corporation | 1 | 100.00% |
| Emc Outside Counsel Dergosits & Noah | 1 | 0% |
What are Flexenable‘ key innovation segments?
What Technologies are Covered by Flexenable?

The chart below distributes patents filed by Flexenable
