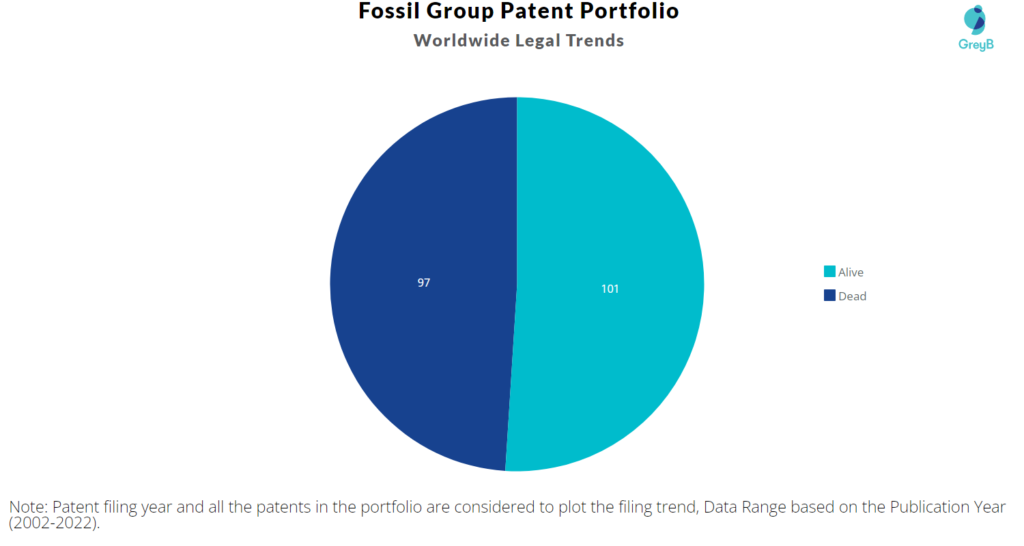
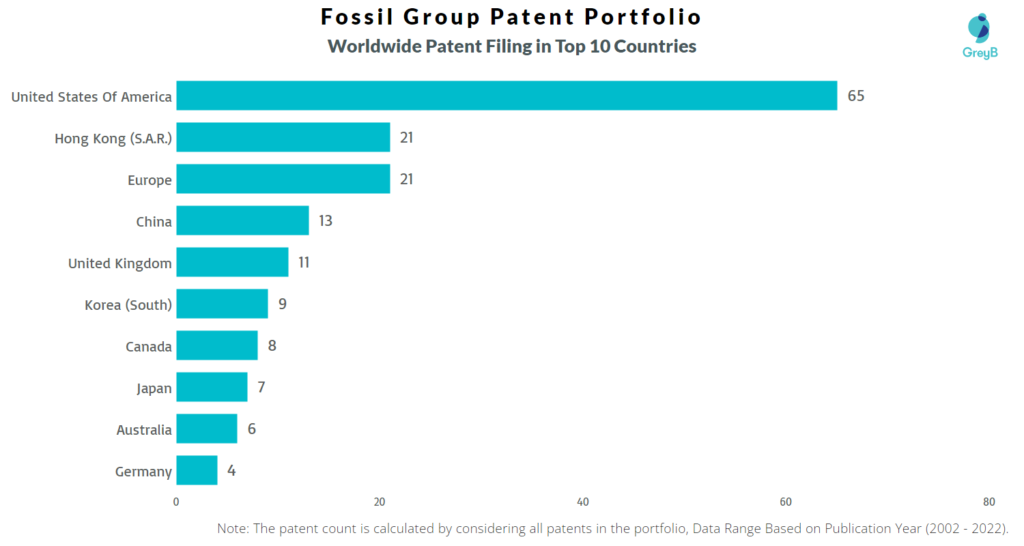
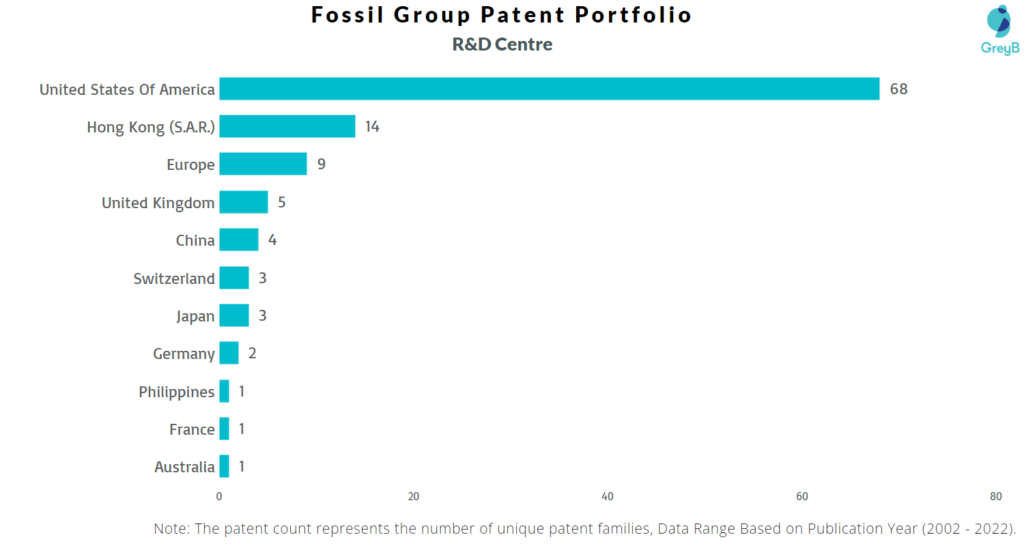
Fossil has a total of 198 patents globally, out of which 137 have been granted. Of these 198 patents, only 51% patents of the portfolio are active. The United States of America is where Fossil has filed the maximum number of patents, followed by Hong Kong and Europe. The USA seems to be the main focused R&D center and is also the origin country of Fossil.
Fossil was founded in the year 1984. Fossil designs, develops, markets, and distributes consumer fashion accessories. The Company products include an extensive line of men and women fashion watches and jewelry sold under proprietary and licensed brands, handbags, small leather goods, belts, sunglasses, and apparel. As of December 2022, the market cap of Fossil is $215.64 Million.
Do read about some of the most popular patents of Fossil which have been covered by us in this report and also you can find Fossil’s patents information, the worldwide patent filing activity and its patent filing trend over the years, and many other stats over Fossil’s patent portfolio.
How many patents does Fossil have?
Fossil has a total of 198 patents globally. These patents belong to 111 unique patent families. Out of 198 patents, 101 patents are active.
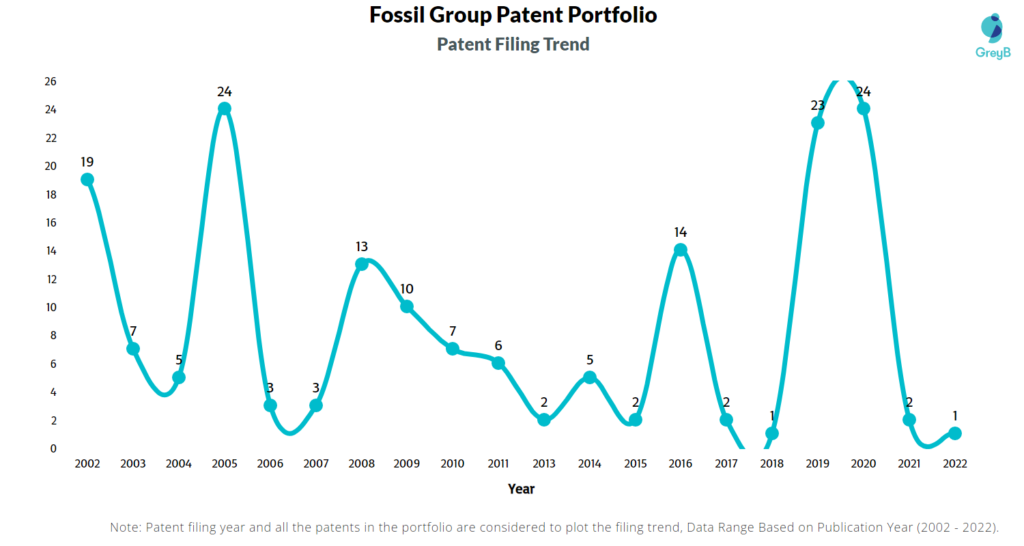
How Many Patents did Fossil File Every Year?

Are you wondering why there is a drop in patent filing for the last two years? It is because a patent application can take up to 18 months to get published. Certainly, it doesn’t suggest a decrease in the patent filing.
| Year of Patents Filing or Grant | Fossil Applications Filed | Fossil Patents Granted |
| 2022 | 1 | 6 |
| 2021 | 2 | 8 |
| 2020 | 24 | 4 |
| 2019 | 23 | 4 |
| 2018 | 1 | – |
| 2017 | 2 | 7 |
| 2016 | 14 | 6 |
| 2015 | 2 | – |
| 2014 | 5 | 1 |
| 2013 | 2 | 2 |
| 2012 | – | 1 |
| 2011 | 6 | 8 |
How many Fossil patents are Alive/Dead?
Worldwide Patents

How Many Patents did Fossil File in Different Countries?

Countries in which Fossil Filed Patents
| Country | Patents |
| United States Of America | 65 |
| Hong Kong (S.A.R.) | 21 |
| Europe | 21 |
| China | 13 |
| United Kingdom | 11 |
| Korea (South) | 9 |
| Canada | 8 |
| Japan | 7 |
| Australia | 6 |
| Germany | 4 |
| Switzerland | 3 |
| Italy | 3 |
| Spain | 2 |
| Singapore | 2 |
| France | 1 |
| India | 1 |
| Austria | 1 |
| Mexico | 1 |
| Slovenia | 1 |
| Philippines | 1 |
Where are Research Centres of Fossil Patents Located?

10 Best Fossil Patents
US20040057578A1 is the most popular patent in the Fossil portfolio. It has received 89 citations so far from companies like Microsoft, Google, and Apple.
Below is the list of 10 most cited patents of Fossil:
| Publication Number | Citation Count |
| US20040057578A1 | 89 |
| USD612748S1 | 77 |
| US20210090694A1 | 70 |
| US20030016590A1 | 43 |
| US10395772B1 | 37 |
| USD603724S1 | 34 |
| US20080013409A1 | 29 |
| USD634651S1 | 27 |
| USD622167S1 | 26 |
| US6505763B2 | 26 |
What Percentage of Fossil US Patent Applications were Granted?
Fossil (Excluding its subsidiaries) has filed 27 patent applications at USPTO so far (Excluding Design and PCT applications). Out of these 15 have been granted leading to a grant rate of 60.0%.
Below are the key stats of Fossil patent prosecution at the USPTO.

Which Law Firms Filed Most US Patents for Fossil?
| Law Firm | Total Applications | Success Rate |
| Cooley Llp | 5 | 80.00% |
| Fish & Richardson Pc | 5 | 25.00% |
| 4 | 50.00% | |
| Carstens & Cahoon Llp | 3 | 33.33% |
| Jeffrey G Degenfelder | 2 | 100.00% |
| Rutan & Tucker Llp | 2 | 100.00% |
| Abelman Frayne & Schwab | 1 | 100.00% |
| Carstens Yee & Cahoon Llp | 1 | 100.00% |
| David W Carstens | 1 | 100.00% |
| Fish & Richardson Pc | 1 | 0.00% |
