Every invention tells a story, and patents are the chapters that record humanity’s restless drive to innovate. Between 2019 and 2025, the world has been writing an extraordinary one. In just six years, we’ve seen record-breaking patent publications, the rise of new innovation hubs, and entire industries reinvent themselves through digital transformation and medical breakthroughs.
What’s fascinating, however, is how this story unfolds differently across regions. The United States continues to outpace many of its peers, with filings that surpass Europe’s combined strength, while nations like India and Brazil are steadily emerging as innovation hotspots. At the same time, global giants are fiercely protecting their breakthroughs with some doubling down on litigation, others deepening collaborations with universities to accelerate discovery.
Since this article focuses on countries outside East Asia, we’ve also published a dedicated article on East Asian patent insights drawn from the same dataset. Exploring both pieces together offers a complete picture of how innovation is unfolding across the globe.
Which are the Top 100 Companies in Global Patent Landscape?
The list below presents the top 100 companies based on the count of their total published patents in the last 5 Years (2019 – 2024) along with the percent change in the patent count in the last 2 years.
Top 100 Companies with the Most Published Patents (2019–2024)
| Rank | Company | Headquarter Country | Published Patent (2019 – 2024) | Published Patent in 2023 | Published Patent in 2024 | YoY Change(%) |
|---|---|---|---|---|---|---|
| Samsung | South Korea | 353572 | 79513 | 85846 | 0.079647 | |
| LG | South Korea | 271805 | 23491 | 62714 | 1.669703 | |
| Huawei | China | 214749 | 47265 | 46881 | -0.008124 | |
| Qualcomm | USA | 151012 | 34977 | 39004 | 0.115133 | |
| Mitsubishi | Japan | 120269 | 21486 | 22304 | 0.038071 | |
| Toyota | Japan | 108671 | 21726 | 23566 | 0.084691 | |
| Canon | Japan | 102536 | 21892 | 22199 | 0.014023 | |
| Haier | China | 99033 | 31919 | 13503 | -0.576960 | |
| Bosch | Germany | 94179 | 16259 | 16661 | 0.024725 | |
| State Grid | China | 91101 | 16254 | 13946 | -0.141996 | |
| Panasonic | Japan | 89947 | 17600 | 19121 | 0.086420 | |
| Oppo | China | 84053 | 15589 | 14046 | -0.098980 | |
| Sony | Japan | 82862 | 17601 | 14727 | -0.163286 | |
| Gree | China | 82859 | 13796 | 13949 | 0.011090 | |
| Apple | USA | 78055 | 17105 | 20179 | 0.179714 | |
| Sumitomo | Japan | 76652 | 12244 | 12337 | 0.007596 | |
| BOE Technology | China | 76427 | 15872 | 17086 | 0.076487 | |
| Ericsson | Sweden | 75595 | 14554 | 13275 | -0.087880 | |
| Hyundai | South Korea | 71714 | 16875 | 12290 | -0.271704 | |
| Tencent | China | 66588 | 23174 | 15123 | -0.347415 | |
| Philips | Netherlands | 62146 | 10004 | 9551 | -0.045282 | |
| Fujifilm | Japan | 60720 | 12390 | 11155 | -0.099677 | |
| IBM | USA | 60459 | 12405 | 8932 | -0.279968 | |
| Honda | Japan | 60324 | 12272 | 10459 | -0.147735 | |
| Midea | China | 60237 | 9874 | 10495 | 0.062892 | |
| Microsoft | USA | 59910 | 10643 | 10621 | -0.002067 | |
| USA | 59199 | 12179 | 13620 | 0.118318 | ||
| Intel | USA | 55312 | 9972 | 8841 | -0.113418 | |
| TSMC | Taiwan | 54818 | 13555 | 14409 | 0.063003 | |
| Sinopec | China | 54573 | 13145 | 13833 | 0.052339 | |
| Xiaomi | China | 52197 | 12690 | 14869 | 0.171710 | |
| NTT | Japan | 50635 | 11936 | 11936 | 0.000000 | |
| Vivo | China | 47691 | 11974 | 11320 | -0.054618 | |
| Denso | Japan | 46820 | 9163 | 8298 | -0.094401 | |
| Kia | South Korea | 46295 | 10794 | 10444 | -0.032425 | |
| ZTE | China | 45906 | 9948 | 11225 | 0.128368 | |
| Ford | USA | 43078 | 6194 | 5399 | -0.128350 | |
| NEC | Japan | 42017 | 9789 | 9333 | -0.046583 | |
| Seiko Epson | Japan | 39688 | 8845 | 7615 | -0.139062 | |
| Kyocera | Japan | 36930 | 4472 | 11725 | 1.621869 | |
| BASF | Germany | 35765 | 6439 | 6348 | -0.014133 | |
| China Mobile | China | 34039 | 13378 | 12036 | -0.100314 | |
| Sharp | Japan | 33569 | 5417 | 5154 | -0.048551 | |
| Toshiba | Japan | 32190 | 6612 | 6469 | -0.021627 | |
| Boeing | USA | 31687 | 4774 | 4139 | -0.133012 | |
| Murata Manufacturing | Japan | 31551 | 7109 | 6929 | -0.025320 | |
| Applied Materials | USA | 30809 | 8058 | 8246 | 0.023331 | |
| Ricoh | Japan | 30577 | 5656 | 5112 | -0.096181 | |
| BMW | Germany | 30446 | 5373 | 6294 | 0.171413 | |
| Nokia | Finland | 30136 | 6073 | 8605 | 0.416927 | |
| Siemens | Germany | 29623 | 4765 | 4289 | -0.099895 | |
| Nippon Steel | Japan | 29140 | 5906 | 5673 | -0.039451 | |
| Nike | USA | 28950 | 4852 | 4997 | 0.029885 | |
| BYD | China | 27962 | 5632 | 10324 | 0.833097 | |
| HP | USA | 27952 | 3667 | 2453 | -0.331061 | |
| Micron Technology | USA | 27596 | 6306 | 6354 | 0.007612 | |
| Roche | Switzerland | 27579 | 4998 | 4720 | -0.055622 | |
| Volkswagen | Germany | 27261 | 4252 | 4459 | 0.048683 | |
| Dow | USA | 26638 | 5297 | 4640 | -0.124032 | |
| 3M | USA | 26621 | 3582 | 3015 | -0.158291 | |
| Schaeffler | Germany | 26526 | 4231 | 4165 | -0.015599 | |
| Tokyo Electron | Japan | 26129 | 5974 | 6578 | 0.101105 | |
| Daikin | Japan | 25654 | 6086 | 5840 | -0.040421 | |
| Fujitsu | Japan | 25558 | 4528 | 3365 | -0.256846 | |
| GM Global | United States | 25407 | 4885 | 5800 | 0.187308 | |
| Geely | China | 25107 | 5777 | 7182 | 0.243206 | |
| Procter & Gamble | USA | 24988 | 4119 | 3993 | -0.030590 | |
| Semiconductor Energy Laboratory | Japan | 24914 | 5235 | 5314 | 0.015091 | |
| Baidu | China | 24855 | 8583 | 5975 | -0.303856 | |
| JFE Steel | Japan | 24563 | 5731 | 6154 | 0.073809 | |
| Inspur | China | 24499 | 6892 | 5465 | -0.207052 | |
| Halliburton | USA | 23899 | 4548 | 3598 | -0.208883 | |
| Nissan | Japan | 23890 | 4165 | 3795 | -0.088836 | |
| General Electric | United States | 23786 | 3724 | 5420 | 0.455424 | |
| Guangdong Power Grid | China | 23570 | 4660 | 5361 | 0.150429 | |
| PetroChina | China | 23040 | 4501 | 6425 | 0.427461 | |
| Philip Morris | Switzerland | 22731 | 4837 | 4494 | -0.070912 | |
| Hitachi | Japan | 22675 | 4940 | 8501 | 0.720850 | |
| Nitto Denko | Japan | 22573 | 4729 | 4577 | -0.032142 | |
| Sanyo Bussan | Japan | 21645 | 6025 | 5201 | -0.136763 | |
| SK Hynix | South Korea | 21369 | 4872 | 5318 | 0.091544 | |
| CATL | China | 21148 | 7149 | 12873 | 0.800671 | |
| Ping An Technology | China | 21106 | 4518 | 3451 | -0.236166 | |
| Saudi Aramco | Saudi Arabia | 20926 | 3830 | 4545 | 0.186684 | |
| Toray Industries | Japan | 19711 | 3442 | 3351 | -0.026438 | |
| Audi | Germany | 19633 | 3005 | 2997 | -0.002662 | |
| FAW | China | 19393 | 5354 | 6578 | 0.228614 | |
| Amazon | USA | 19305 | 2845 | 3225 | 0.133568 | |
| Brother | Japan | 19083 | 4131 | 3958 | -0.041878 | |
| Honeywell | USA | 18739 | 3178 | 3336 | 0.049717 | |
| Konica Minolta | Japan | 18339 | 2817 | 2863 | 0.016329 | |
| Honor | China | 18164 | 7555 | 8215 | 0.087359 | |
| Omron | Japan | 18086 | 3262 | 3179 | -0.025445 | |
| Lenovo | China | 18001 | 3346 | 4659 | 0.392409 | |
| Great Wall Motor | China | 17817 | 4642 | 4941 | 0.064412 | |
| Fanuc | Japan | 17628 | 3529 | 3304 | -0.063757 | |
| Dai Nippon Printing | Japan | 17501 | 3649 | 3294 | -0.097287 | |
| Mercedes-Benz | Germany | 17345 | 2797 | 3959 | 0.415445 | |
| Nicoventures | United Kingdom | 17245 | 4482 | 5219 | 0.164436 | |
| China Telecom | China | 15212 | 5490 | 4833 | -0.119672 |
Which are the Top 50 Most Innovative Countries with Most Patents Globally?
The list below presents the top 50 countries based on the count of their total published patents in the last 5 Years (2019 - 2024) along with the percent change in the patent count in the last 2 years as well as the percentage change in patent count in the last 5 years.
Top 50 Countries with the Most Published Patents (2019–2024)
| Rank | Country | Total Patents Published in Last 5 Years | Published Patent in 2019 | Published Patent in 2023 | Published Patent in 2024 | YoY Change(%) | Change in Last 5 Years(%) |
|---|---|---|---|---|---|---|---|
| 1 | China | 34779737 | 4115200 | 5287608 | 5400303 | 0.021313 | 0.312282 |
| 2 | United States of America | 4928773 | 746445 | 734454 | 769280 | 0.047418 | 0.030592 |
| 3 | Japan | 3287401 | 498023 | 516620 | 488928 | -0.053602 | -0.018262 |
| 4 | Europe (EPO) | 2795152 | 427171 | 420834 | 453394 | 0.07737 | 0.061388 |
| 5 | South Korea | 2211179 | 304213 | 349483 | 341113 | -0.02395 | 0.121297 |
| 6 | Germany | 1481202 | 263105 | 209208 | 217847 | 0.041294 | -0.172015 |
| 7 | India | 843717 | 85012 | 163722 | 209515 | 0.2797 | 1.464534 |
| 8 | Great Britain | 746944 | 165545 | 94216 | 89694 | -0.047996 | -0.45819 |
| 9 | Taiwan | 641338 | 96022 | 97934 | 100583 | 0.027049 | 0.0475 |
| 10 | Austria | 514047 | 134367 | 50183 | 2079 | -0.958572 | -0.984527 |
| 11 | Australia | 413533 | 60342 | 61090 | 66053 | 0.081241 | 0.094644 |
| 12 | Turkey | 375366 | 53334 | 74331 | 43652 | -0.412735 | -0.181535 |
| 13 | Canada | 362920 | 63668 | 66978 | 28330 | -0.577025 | -0.555035 |
| 14 | Brazil | 353812 | 54917 | 49214 | 41593 | -0.154854 | -0.242621 |
| 15 | Russia | 322997 | 62384 | 45296 | 43366 | -0.042609 | -0.304854 |
| 16 | France | 217668 | 32022 | 33503 | 32625 | -0.026207 | 0.018831 |
| 17 | Italy | 217631 | 19570 | 38759 | 30939 | -0.20176 | 0.58094 |
| 18 | Hong Kong | 215726 | 21831 | 31550 | 30216 | -0.042282 | 0.384087 |
| 19 | Spain | 204198 | 28403 | 20688 | 33724 | 0.630124 | 0.187339 |
| 20 | Mexico | 186224 | 29413 | 29925 | 27953 | -0.065898 | -0.049638 |
| 21 | Indonesia | 150700 | 24473 | 21898 | 22706 | 0.036898 | -0.072202 |
| 22 | Poland | 127044 | 22264 | 14793 | 19654 | 0.328601 | -0.11723 |
| 23 | Singapore | 123983 | 16981 | 19506 | 19782 | 0.014149 | 0.164949 |
| 24 | South Africa | 110131 | 15634 | 17187 | 16097 | -0.06342 | 0.029615 |
| 25 | Vietnam | 109306 | 14136 | 15471 | 15392 | -0.005106 | 0.088851 |
| 26 | Israel | 106177 | 13703 | 17127 | 15918 | -0.07059 | 0.161643 |
| 27 | Thailand | 95091 | 12809 | 18043 | 17647 | -0.021948 | 0.377703 |
| 28 | Malaysia | 88044 | 13444 | 13706 | 8715 | -0.364147 | -0.351755 |
| 29 | Philippines | 62881 | 10284 | 7487 | 14192 | 0.895552 | 0.380008 |
| 30 | Ukraine | 59829 | 15398 | 5971 | 6978 | 0.168648 | -0.546824 |
| 31 | Denmark | 55882 | 12982 | 5890 | 5679 | -0.035823 | -0.562548 |
| 32 | New Zealand | 51773 | 4186 | 9560 | 9147 | -0.043201 | 1.185141 |
| 33 | Argentina | 45172 | 6048 | 8940 | 7583 | -0.15179 | 0.253803 |
| 34 | Norway | 39260 | 9274 | 4650 | 3326 | -0.284731 | -0.641363 |
| 35 | Chile | 36964 | 5157 | 6020 | 6090 | 0.011628 | 0.180919 |
| 36 | Saudi Arabia | 34922 | - | 5515 | 6476 | 0.174252 | - |
| 37 | Hungary | 34261 | 6518 | 3916 | 5954 | 0.520429 | -0.08653 |
| 38 | Eurasia | 30776 | 6425 | 5606 | - | - | - |
| 39 | Portugal | 29302 | 6180 | 3368 | 3072 | -0.087886 | -0.502913 |
| 40 | Netherlands | 20399 | 2644 | 3996 | 3227 | -0.192442 | 0.220499 |
| 41 | Colombia | 17937 | 2640 | 2397 | 2107 | -0.120985 | -0.201894 |
| 42 | Switzerland | 15056 | 2404 | 2149 | 2153 | 0.001861 | -0.104409 |
| 43 | Kazakhstan | 14380 | 3015 | - | 1956 | - | -0.351244 |
| 44 | Slovakia | 14277 | 4172 | - | - | - | - |
| 45 | Finland | 12574 | - | 5564 | 4802 | -0.136952 | - |
| 46 | Iran | 11930 | 2258 | 1702 | - | - | - |
| 47 | Croatia | 11421 | 2233 | - | 2061 | - | -0.077026 |
| 48 | Slovenia | 10583 | 3107 | - | - | - | - |
| 49 | Sweden | 9838 | 2286 | 1900 | 1943 | 0.022632 | -0.150044 |
| 50 | Luxembourg | 9346 | - | 2148 | 3115 | 0.450186 | - |
Which Countries have Filed Most Patents Globally from 2019 to 2025?
The chart below presents the number of published patents by the countries globally from 2019 to 2025 contributing to the global innovation and technological advancement.
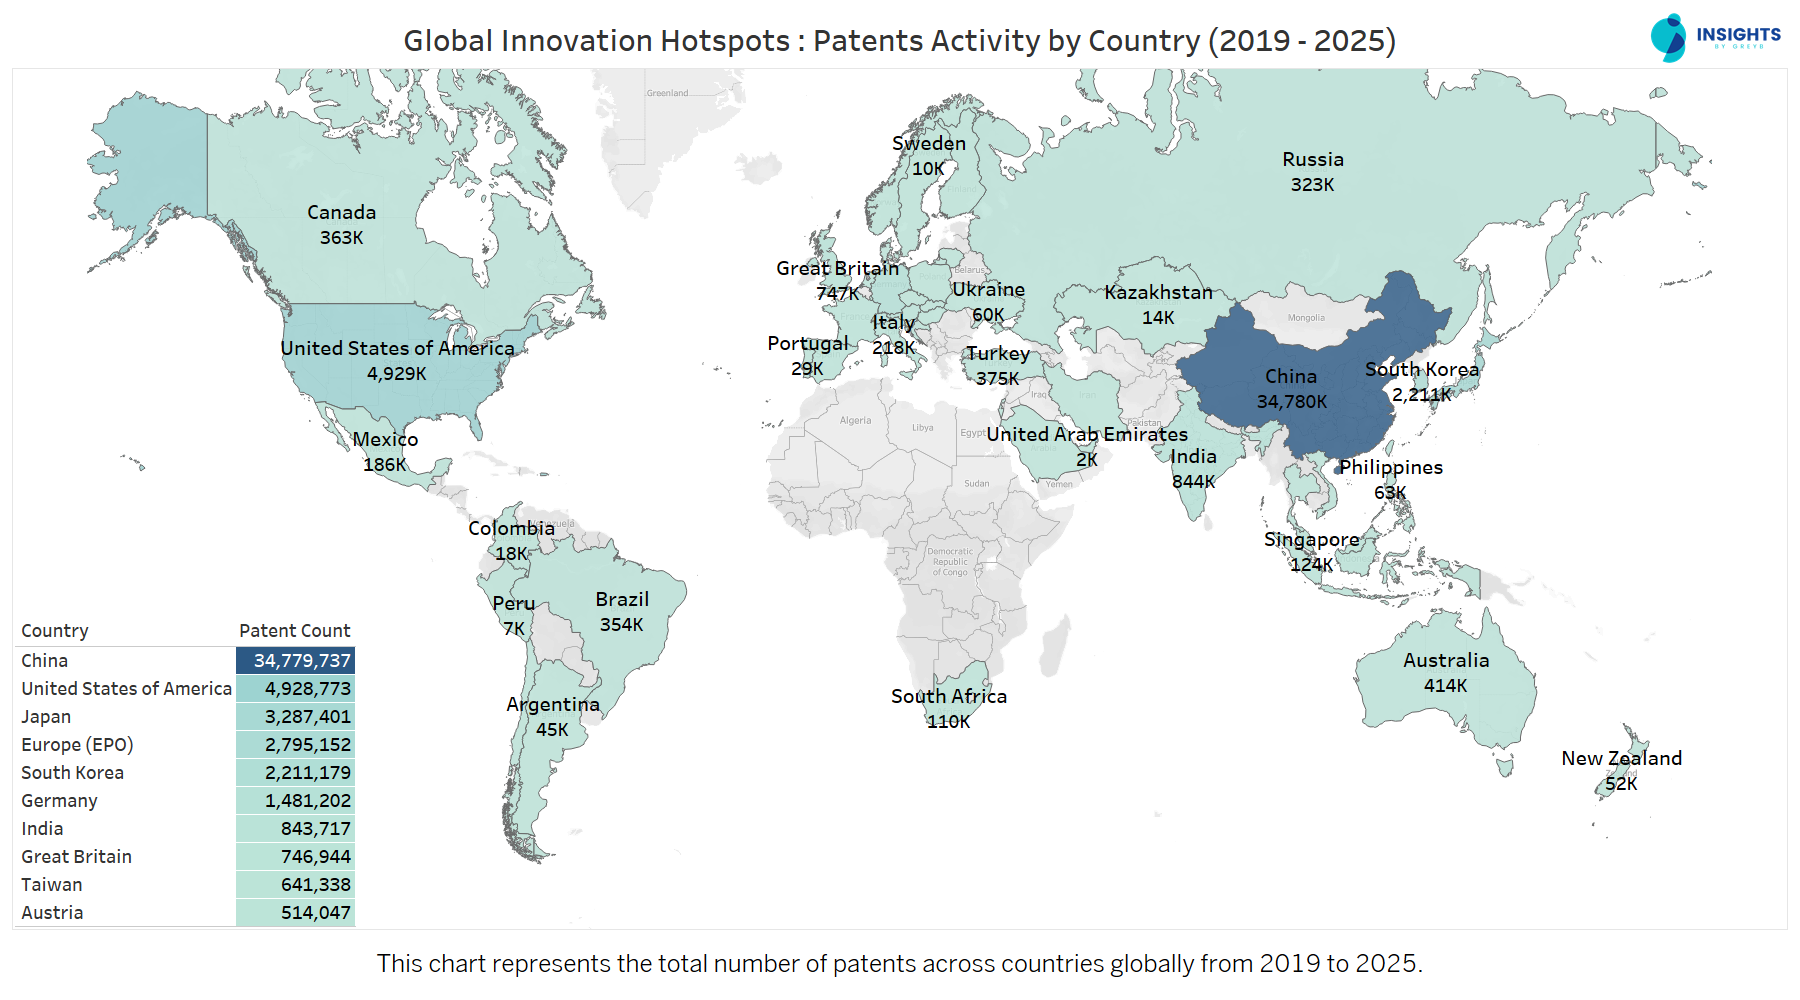
When it comes to patents, the map makes one fact impossible to ignore, China is in a league of its own. With over 34 million patents filed between 2019 and 2025, its volume dwarfs every other nation, more than seven times that of the United States. Japan and South Korea, while far behind China, still stand as global heavyweights, each contributing millions of filings that reinforce East Asia’s dominance.
Beyond this powerhouse trio, Europe (EPO) and the United States form the next tier, while countries like India, Taiwan and Germany emerge as important but secondary players. Interestingly, regions such as Brazil, Russia and Australia appear on the map but with far smaller footprints, hinting at concentrated rather than widespread innovation ecosystems.
Want a deeper dive into US vs Chinese AI patent strategies? Explore AI Patent Landscape: USA vs China.
As this map makes clear, the epicenter of innovation has shifted decisively toward the East, with China, Japan and South Korea driving much of the world’s patent activity. Yet, innovation is not confined to East Asia alone. To offer a more balanced perspective, we now turn to the global patent landscape excluding East Asian countries, uncovering how the rest of the world is contributing to this innovation race.
To begin this exploration, let’s first look at the publication and grant trends from 2019 to 2025, which reveal how patent activity has evolved across these regions outside East Asia.
How Have Global Patent Publications and Grants Evolved Over Time?
This chart showcases the global patent application and grant trends from 2019 to 2025, with a forecasted trend for 2025 and 2026.
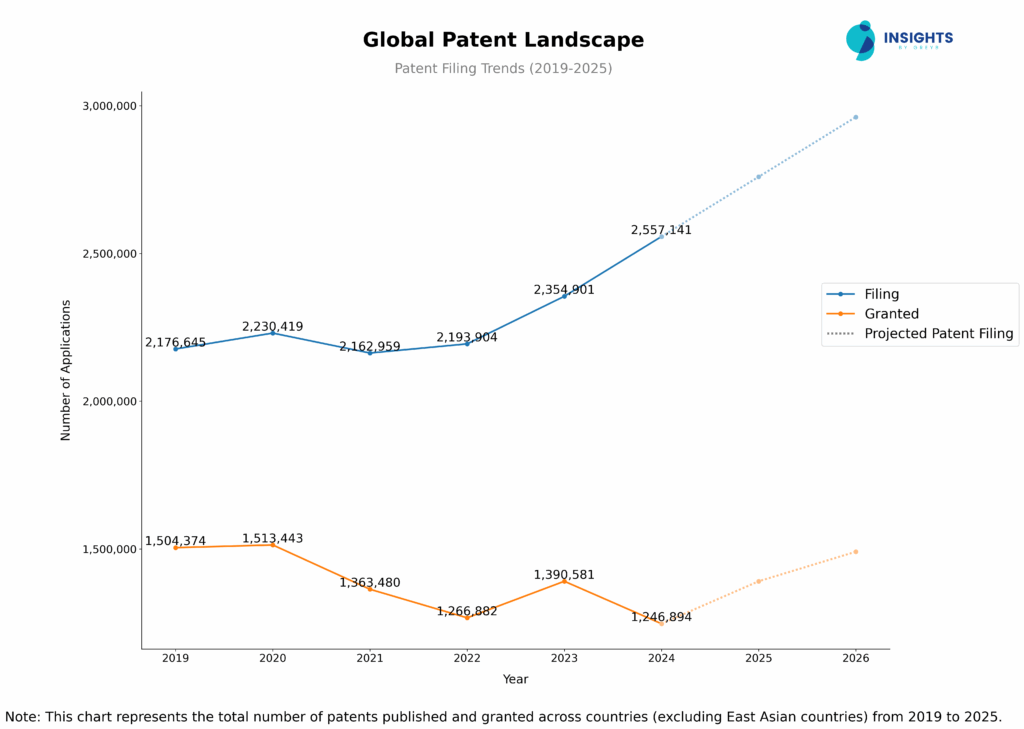
2024 marked a significant milestone, recording the highest number of patent publications in the past six years, with a 9% increase over 2023. This surge indicates the continued growth in global patent filings, with industries pushing forward in key sectors like AI, biotech and clean tech. It’s clear that patent activity remains a key indicator of innovation, and the global race to protect intellectual property is intensifying.
You might wonder about the drop in patent filings over the last two years. However, this drop is not necessarily a reflection of a decrease in innovation. The timing of patent applications and the publication process contribute to the shift. Since patent applications can take up to 18 months to be published, the chart includes the most recent year's patent count for accurate comparisons.
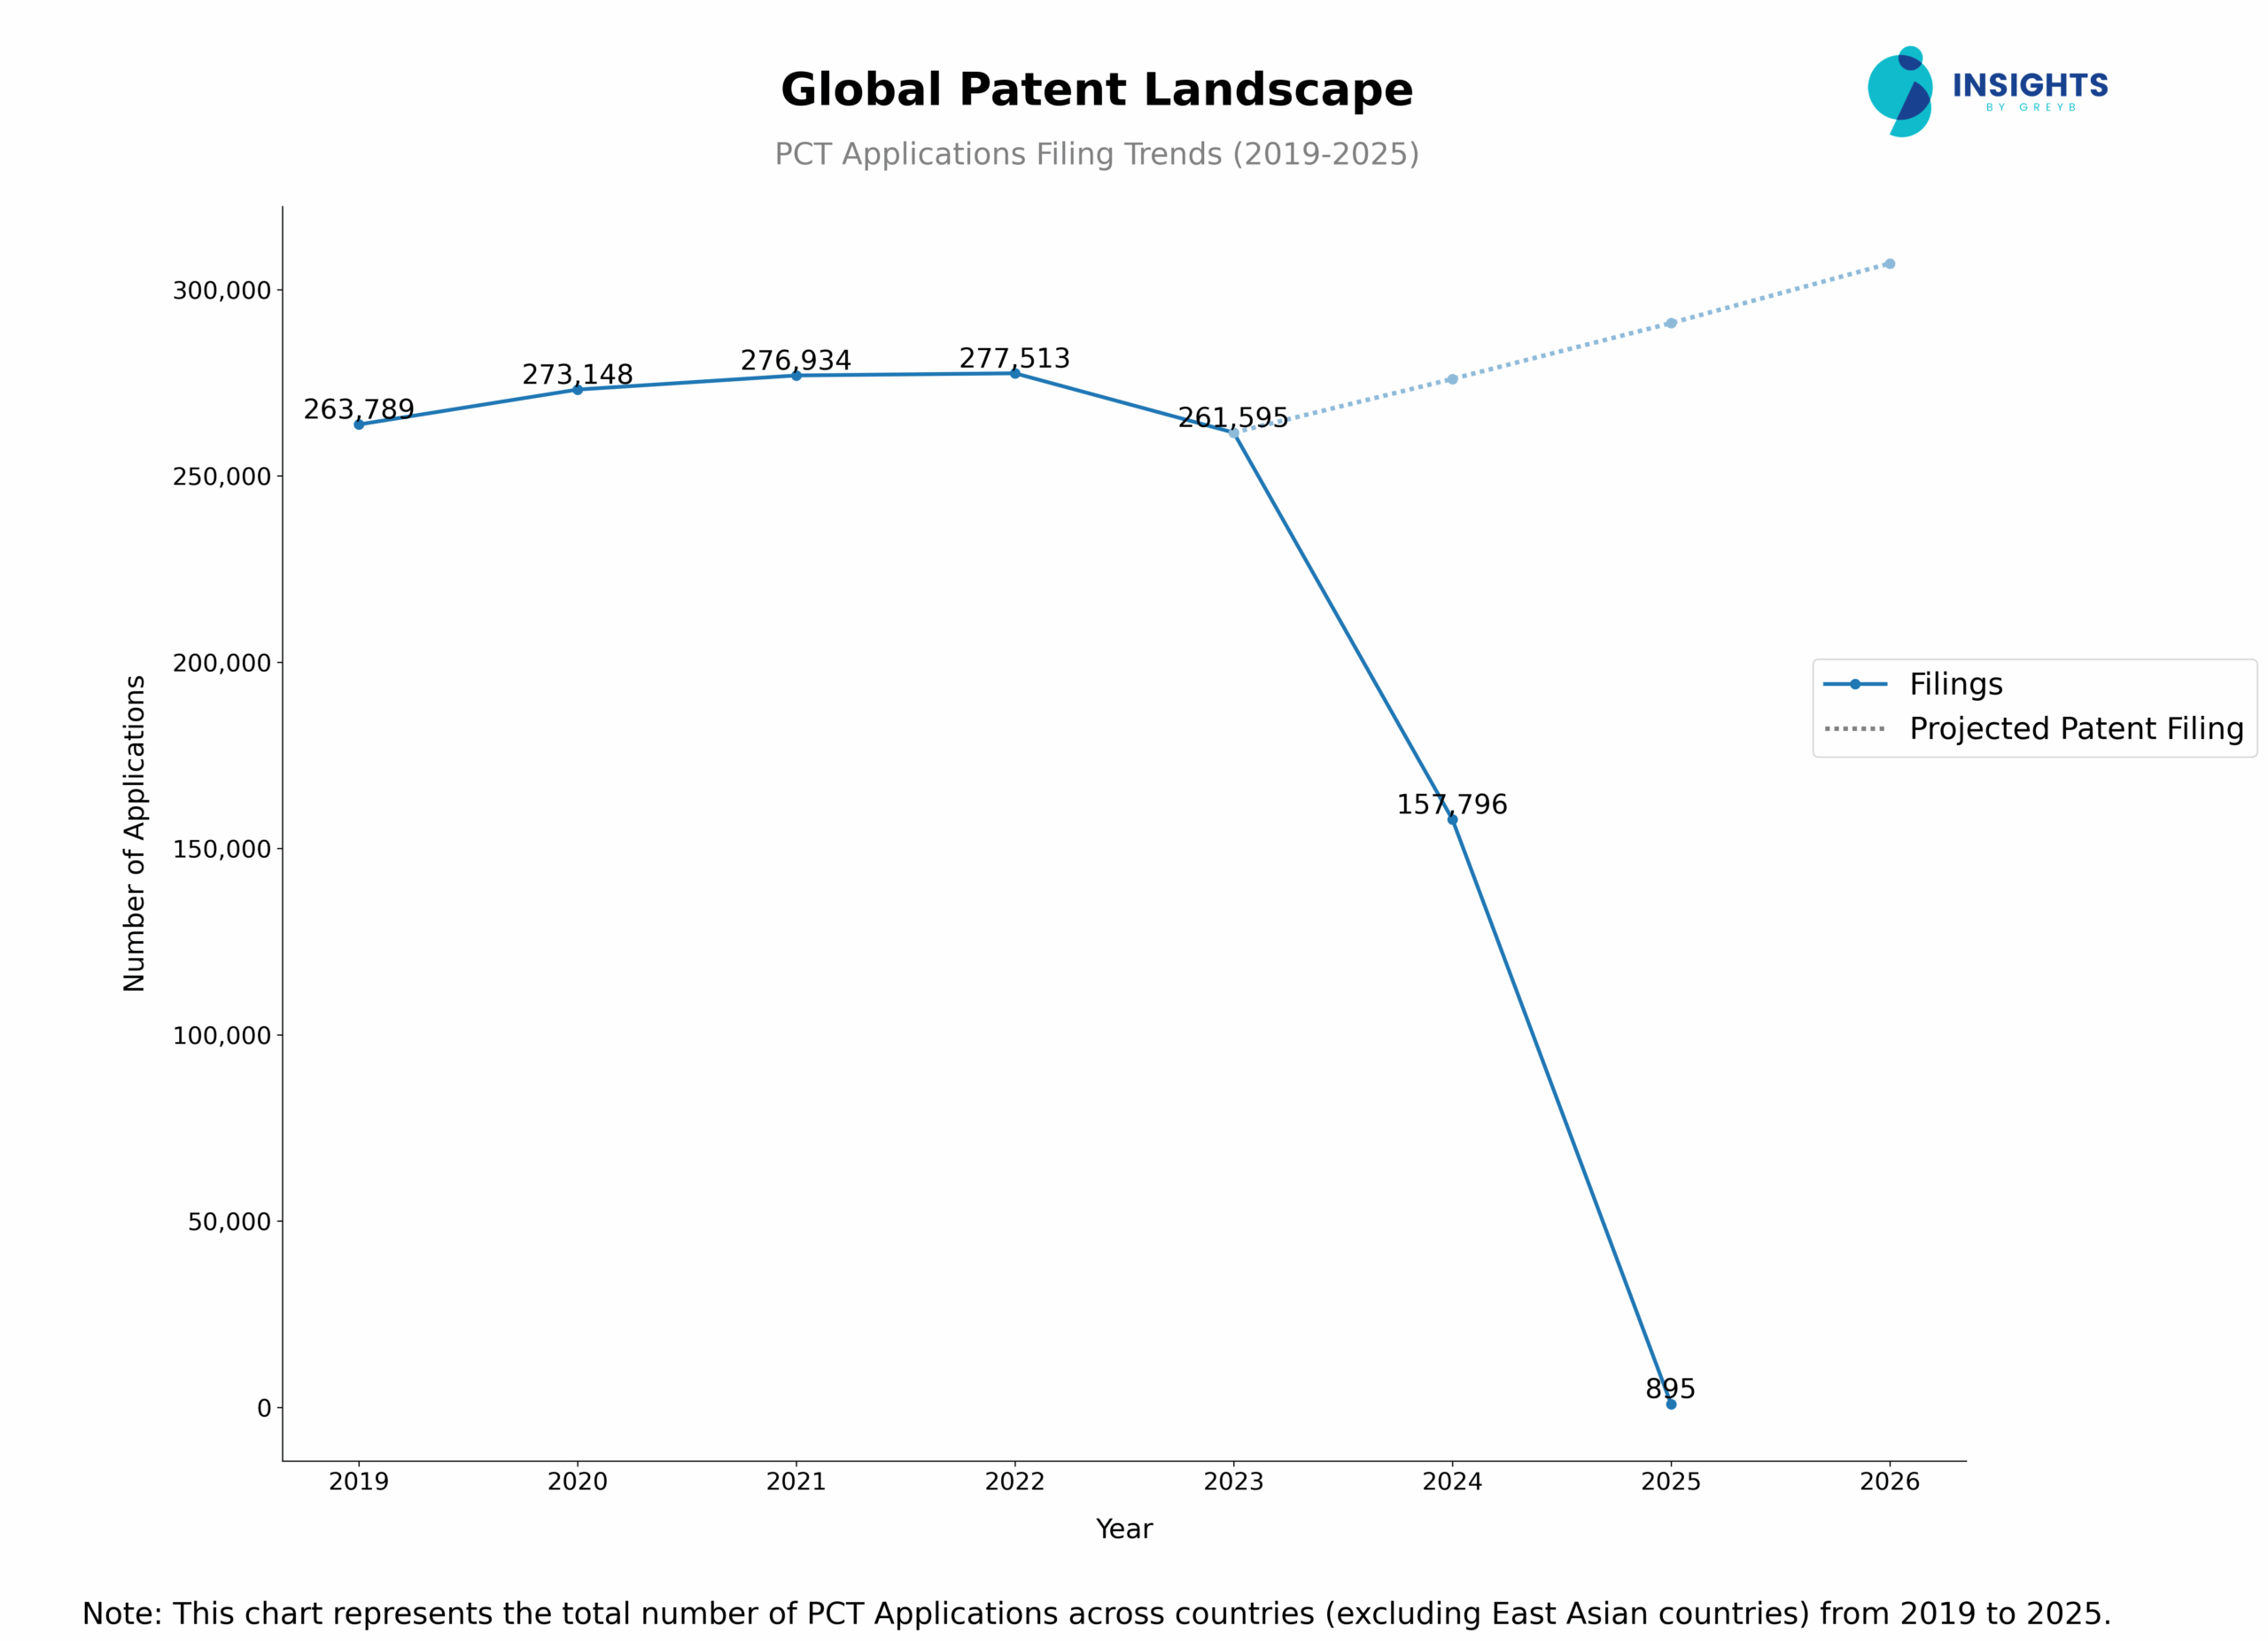
There has been a significant decline in PCT filings in 2024. The number of filings dropped to 157,796 in 2024 from 261,595 in 2023, reflecting a 40% decrease.Similarly, looking at European countries, we see a slight decrease in patent applications and grants over the past few years. For instance, patent applications in 2024 dropped to 936,092, marking a 7.2% decrease from the 2023 with 1,008,888 patent applications. Granted patents in 2024 also saw a decline to 592,783, a 16.9% drop from 2023's total of 714,639.
How Does Patent Legal Status Impact Global Innovation?
This chart visually represents the legal status of patents across countries (excluding East Asia), showing the proportion of active vs inactive patents from 2019 to 2025.
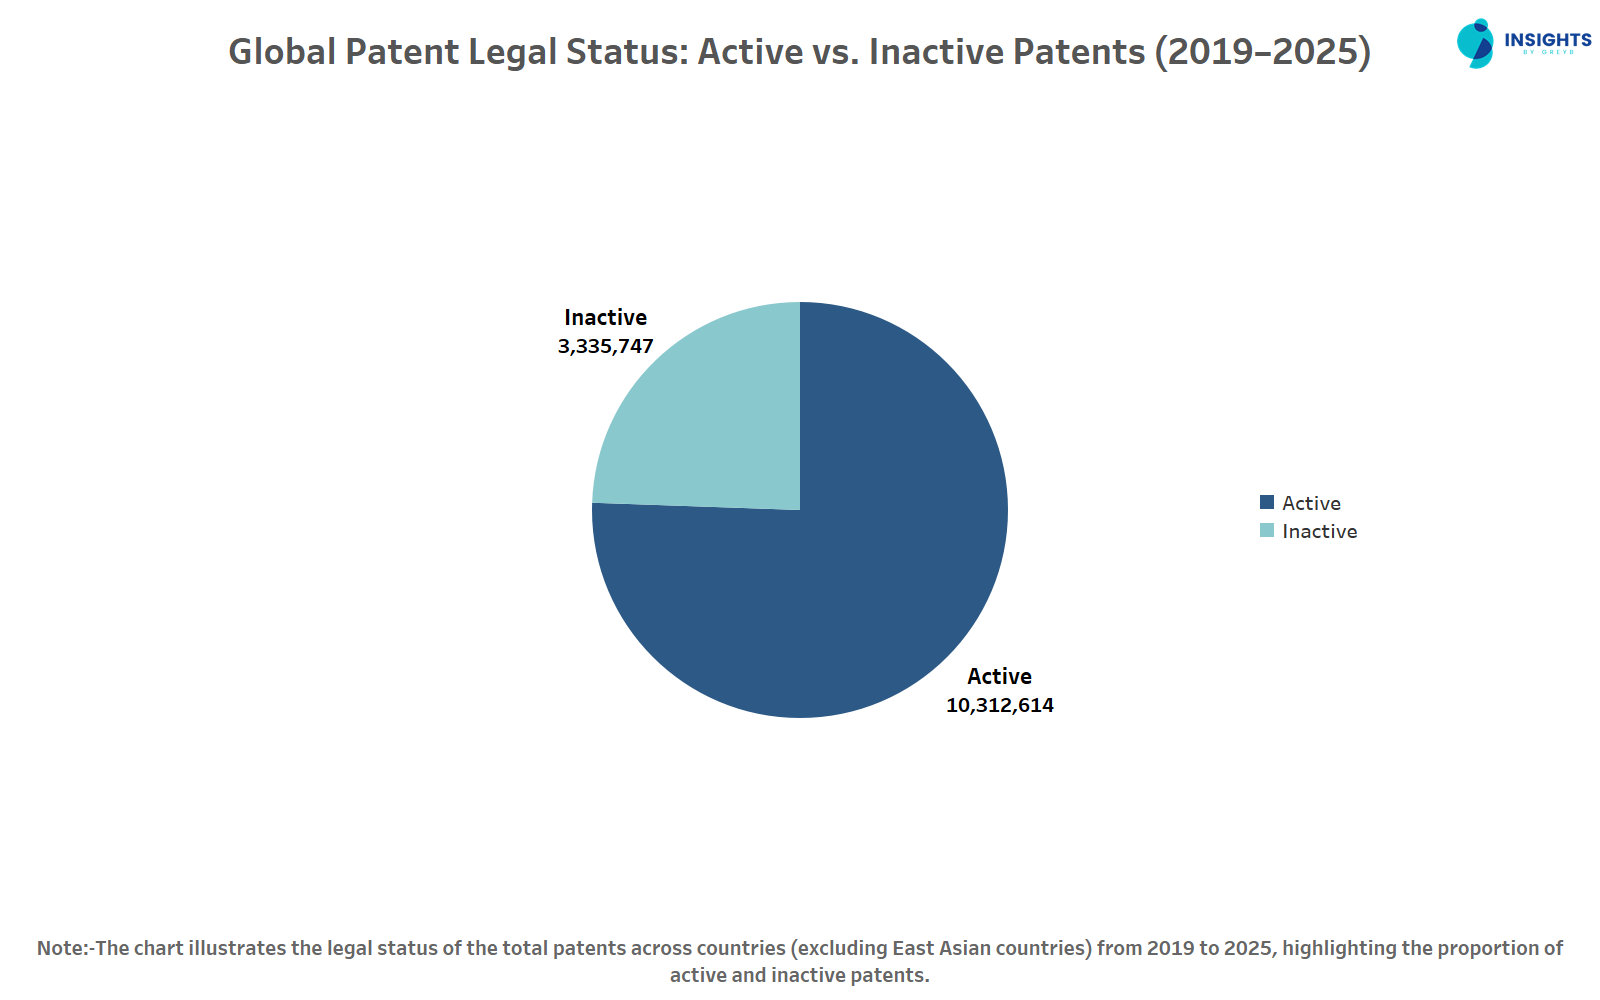
The active vs inactive patent status chart reveals a clear picture of global innovation activity. Roughly 76% of patents remain active, underscoring the sustained innovation and market competitiveness that these patents continue to protect.
On the other hand, 24% of patents have transitioned to inactive status, suggesting strategic decisions in IP management, such as patent expirations, abandonments or non-renewals. This highlights the natural life cycle of patents, where some innovations may no longer be commercially viable, or companies may choose not to maintain their protection due to shifting market priorities or changing business strategies.
Where Are the World's Leading R&D Centers Located?
This chart illustrates the global distribution of research centers based on unique patent families filed between 2019 and 2025, highlighting the key innovation hubs around the world.
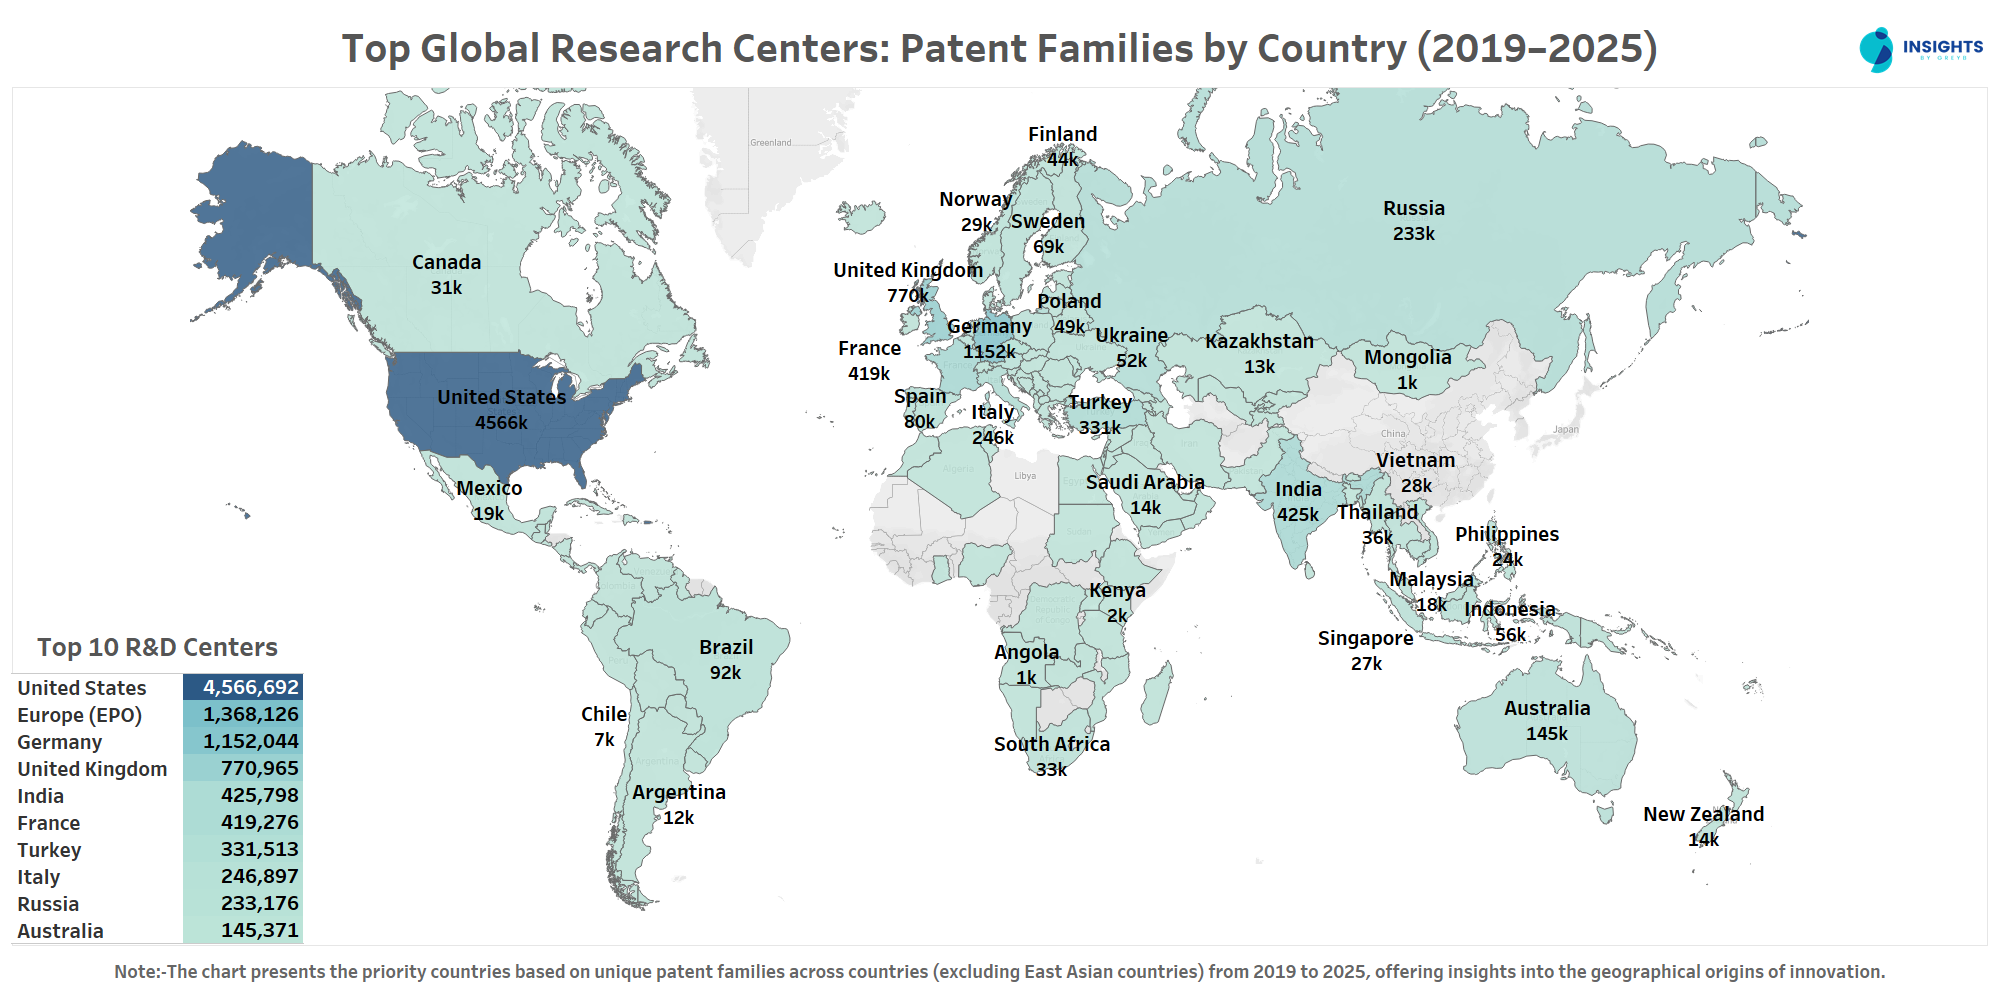
The United States continues its reign as the global leader in R&D, with a staggering 4.56 million patent families filed from 2019 to 2025. This figure alone surpasses the combined total of the next five leading research centers, demonstrating the dominance of US-based institutions and corporations in driving cutting-edge innovation. Leading the charge in areas such as AI, biotechnology and telecommunications, these centers are at the forefront of technological advancements that are reshaping industries.
Which are the Top Companies in Global Patent Landscape?
This chart presents the patent activity of the top global companies based on the total patents filed from 2019 to 2025, showcasing their influence and dominance in driving innovation across various sectors.
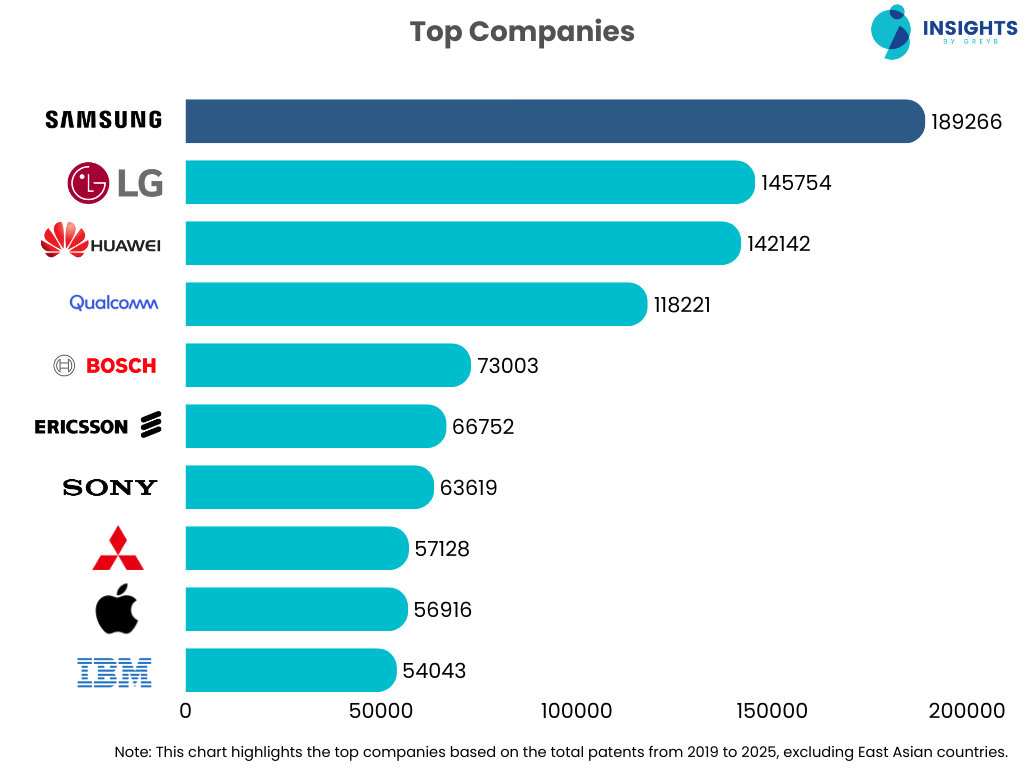
Samsung leads the pack with 189,266 patents filed globally from 2019 to 2025, far surpassing its competitors and emphasizing the company's leadership in innovation. In PCT applications as well, Samsung continued its stronghold, with 23,928 patents globally, demonstrating its robust international presence and influence.
LG follows closely with 145,754 patents, showcasing its leadership in electronics and telecommunications, driven by innovations in smart devices, AI-powered solutions and consumer electronics. Huawei also stands as a major contributor to global patent filings, with 142,142 patents, largely focused on 5G infrastructure, AI solutions and telecommunications. With 41,429 patents in PCT filings, Huawei’s influence is clearly global, positioning it as one of the leading telecom innovators globally.
How Have Patent Filings Evolved Among the Leading Companies Over Time?
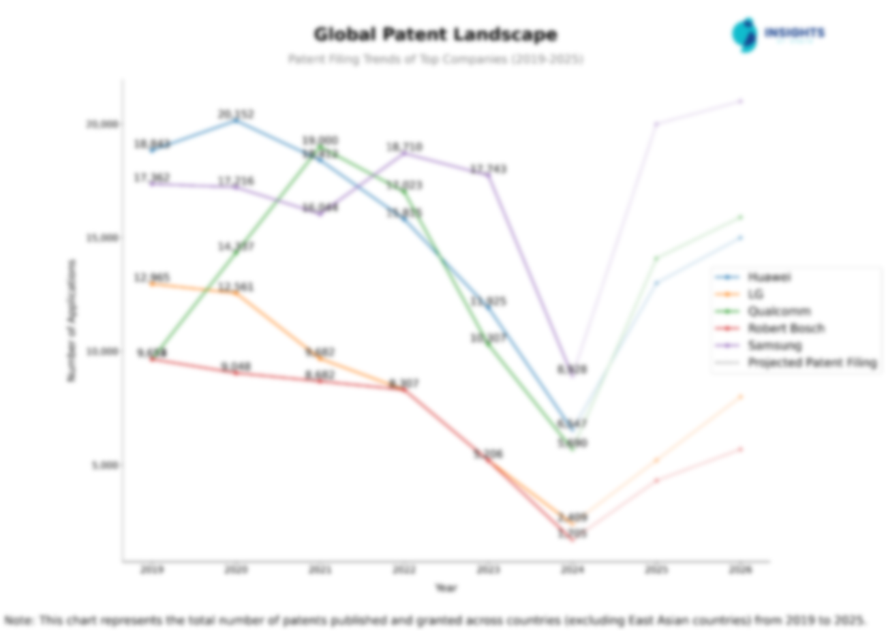
Patent filings from 2019 to 2025 show a clear reshaping of the leaderboard. Giants like Samsung, LG and Huawei widened their lead, while US companies such as Qualcomm, Apple and Microsoft consolidated strength in their home market. The full report lays out these year-by-year shifts, helping you see not just who leads today, but who is poised to dominate tomorrow.
Fill out the form to access the complete analysis.
Where Are The Target Markets of Top Companies?
This chart highlights the global target markets of top companies based on patent filings from 2019 to 2025, providing insights into regional patent protection strategies and expansion priorities.
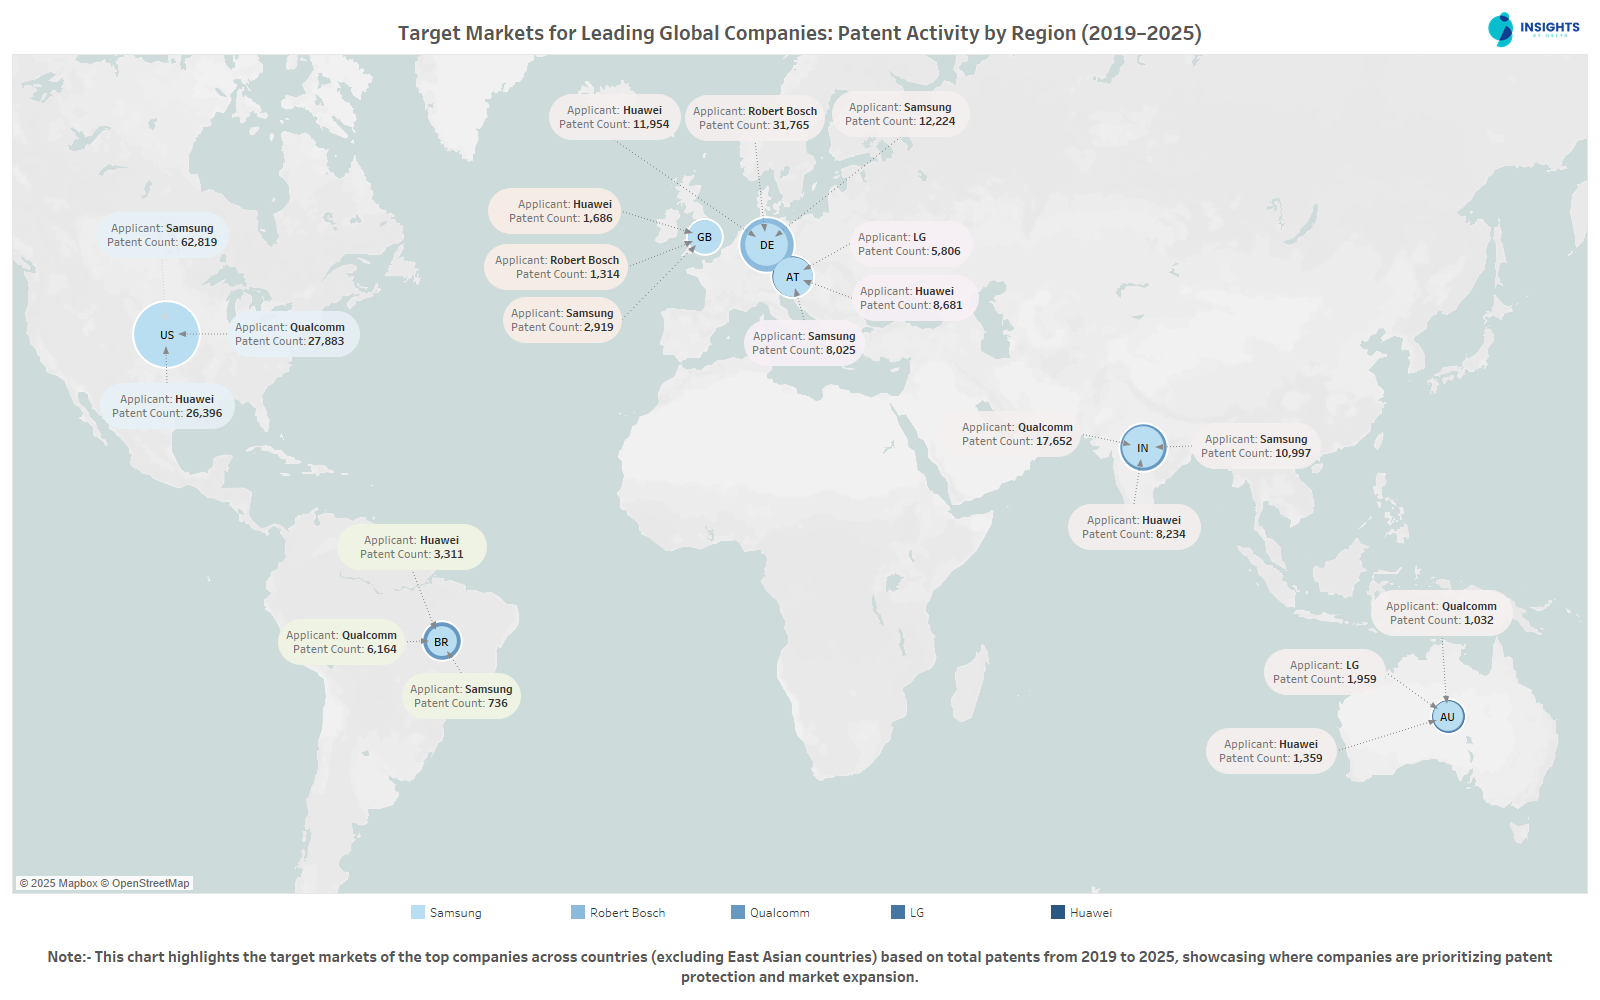
Leading innovators overwhelmingly secure patents in their headquarters’ markets before expanding overseas. Take Qualcomm, headquartered in the United States: it filed 27,883 patents in the US more than 1.5 times its 17,835 filings at the EPO and under 7,000 in Germany. Similarly, Apple, based in the US protected 25,875 patents at home, but only 8,973 at the EPO and 2,990 in India. Microsoft, also based in the US, shows the same pattern with 19,254 US patents versus 8,852 in Europe.
In Germany, Robert Bosch with its global HQ in Stuttgart leads with 31,765 patents on home soil, compared to 11,271 at the EPO and a mere 410 in Brazil. Since our chart excludes East Asia, Samsung and LG (both South Korea–based) default to the next-largest markets: Samsung’s 62,819 US patents and LG’s 24,890 in the US underscore how these giants use the US as a proxy home market.
Which Key Technology Dominates Global Innovation?
This chart highlights the top technology areas based on total patents between 2019 and 2025. It provides insights into which technology domains are driving global innovation and where R&D efforts are concentrated.
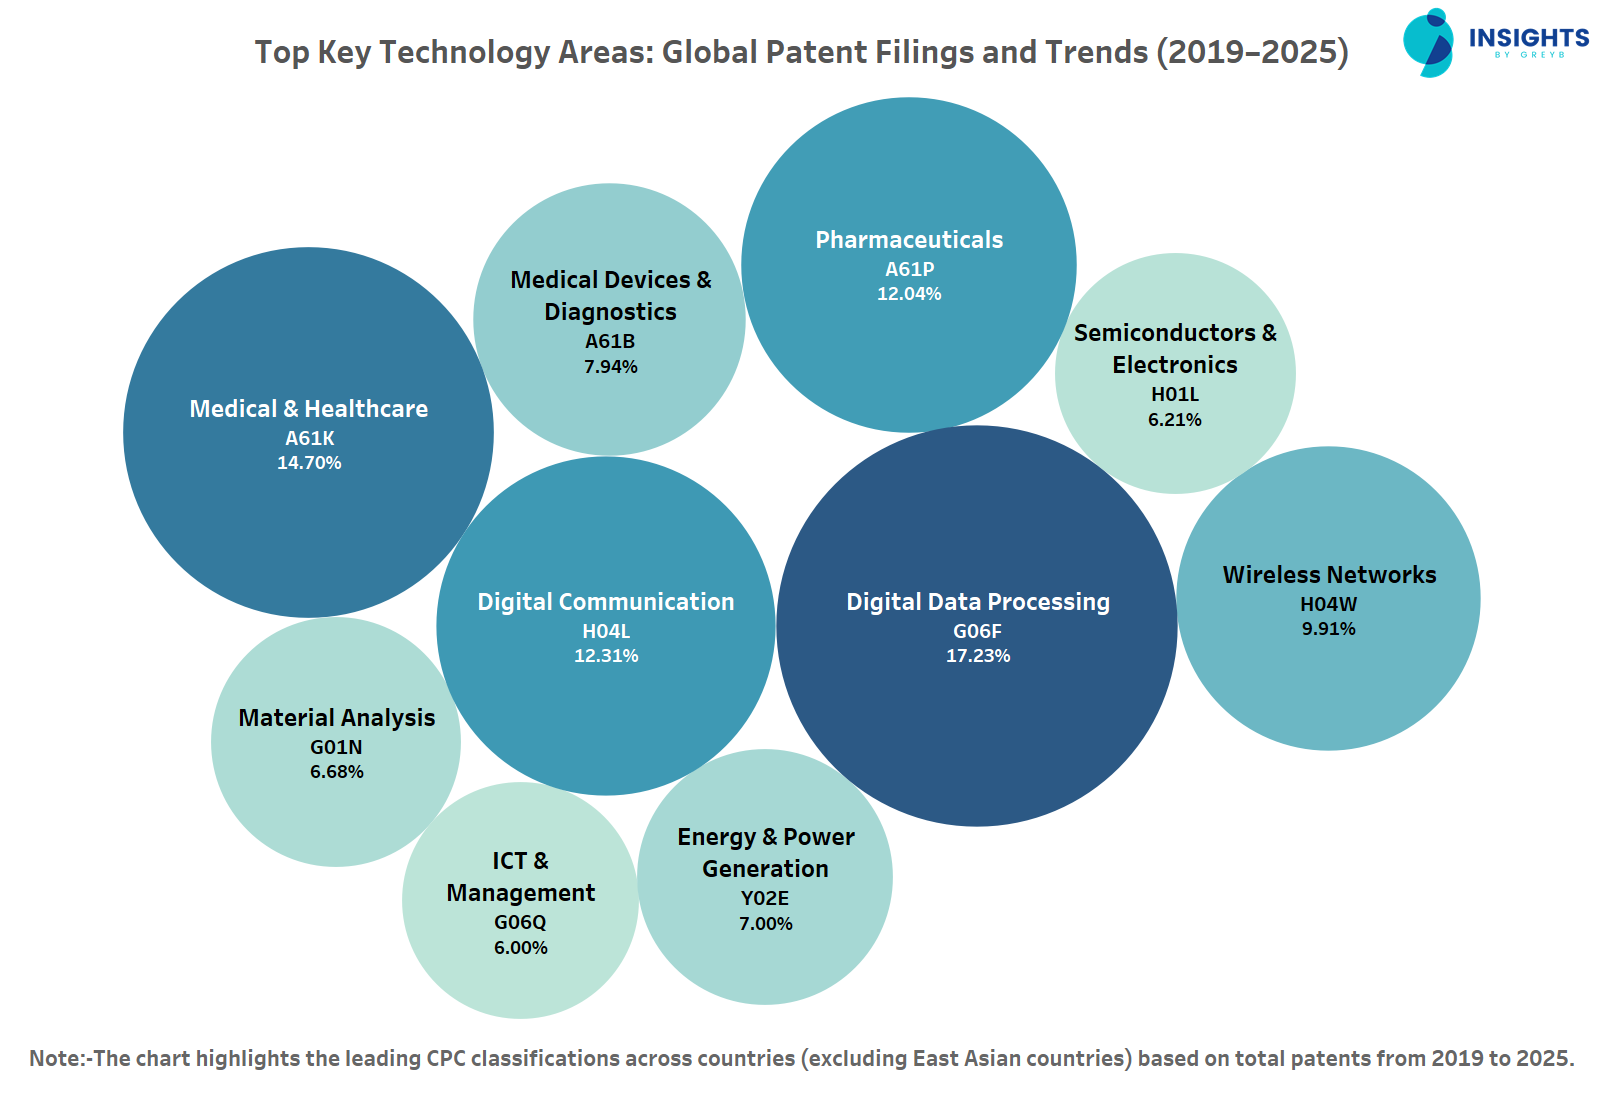
The world of innovation is experiencing a digital transformation, and the patent landscape tells a compelling story of this shift. The leading technology domains, such as Digital Data Processing (G06F) and Digital Communication (H04L), underscore the global push toward digitization across industries. With a staggering 17.23% of all patents in the period from 2019 to 2025, Digital Data Processing remains the dominant field, driving AI, cloud computing and big data innovations.
Looking at PCT applications, Digital Data Processing again dominates with 16.35% of global filings, emphasizing the sector's global significance. Wireless Networks (H04W) takes 13.25% of global filings, followed closely by Medical & Healthcare (A61K) at 12.83%.
Interestingly, Europe also shows a clear focus on Medical & Healthcare (A61K), which represents 15.64% of total patents filed in the region. While Digital Data Processing (G06F) and Pharmaceuticals (A61P) remain central, Europe’s focus on Energy & Power Generation (Y02E) and Green Transportation (Y02T) highlights the region’s commitment to sustainability and environmental technologies.
As industries converge around healthcare, data, and advanced electronics, staying ahead of what’s next is critical. With Slate, you can dive deeper into emerging trends, monitor competitors, and uncover breakthrough technologies in real time.
Fill out the form to get started with Slate.
Which Countries Lead in Key Technology Patents?
This chart illustrates the country-wise distribution of key technology areas, showcasing which nations dominate specific technology areas based on total patents filed from 2019 to 2025.
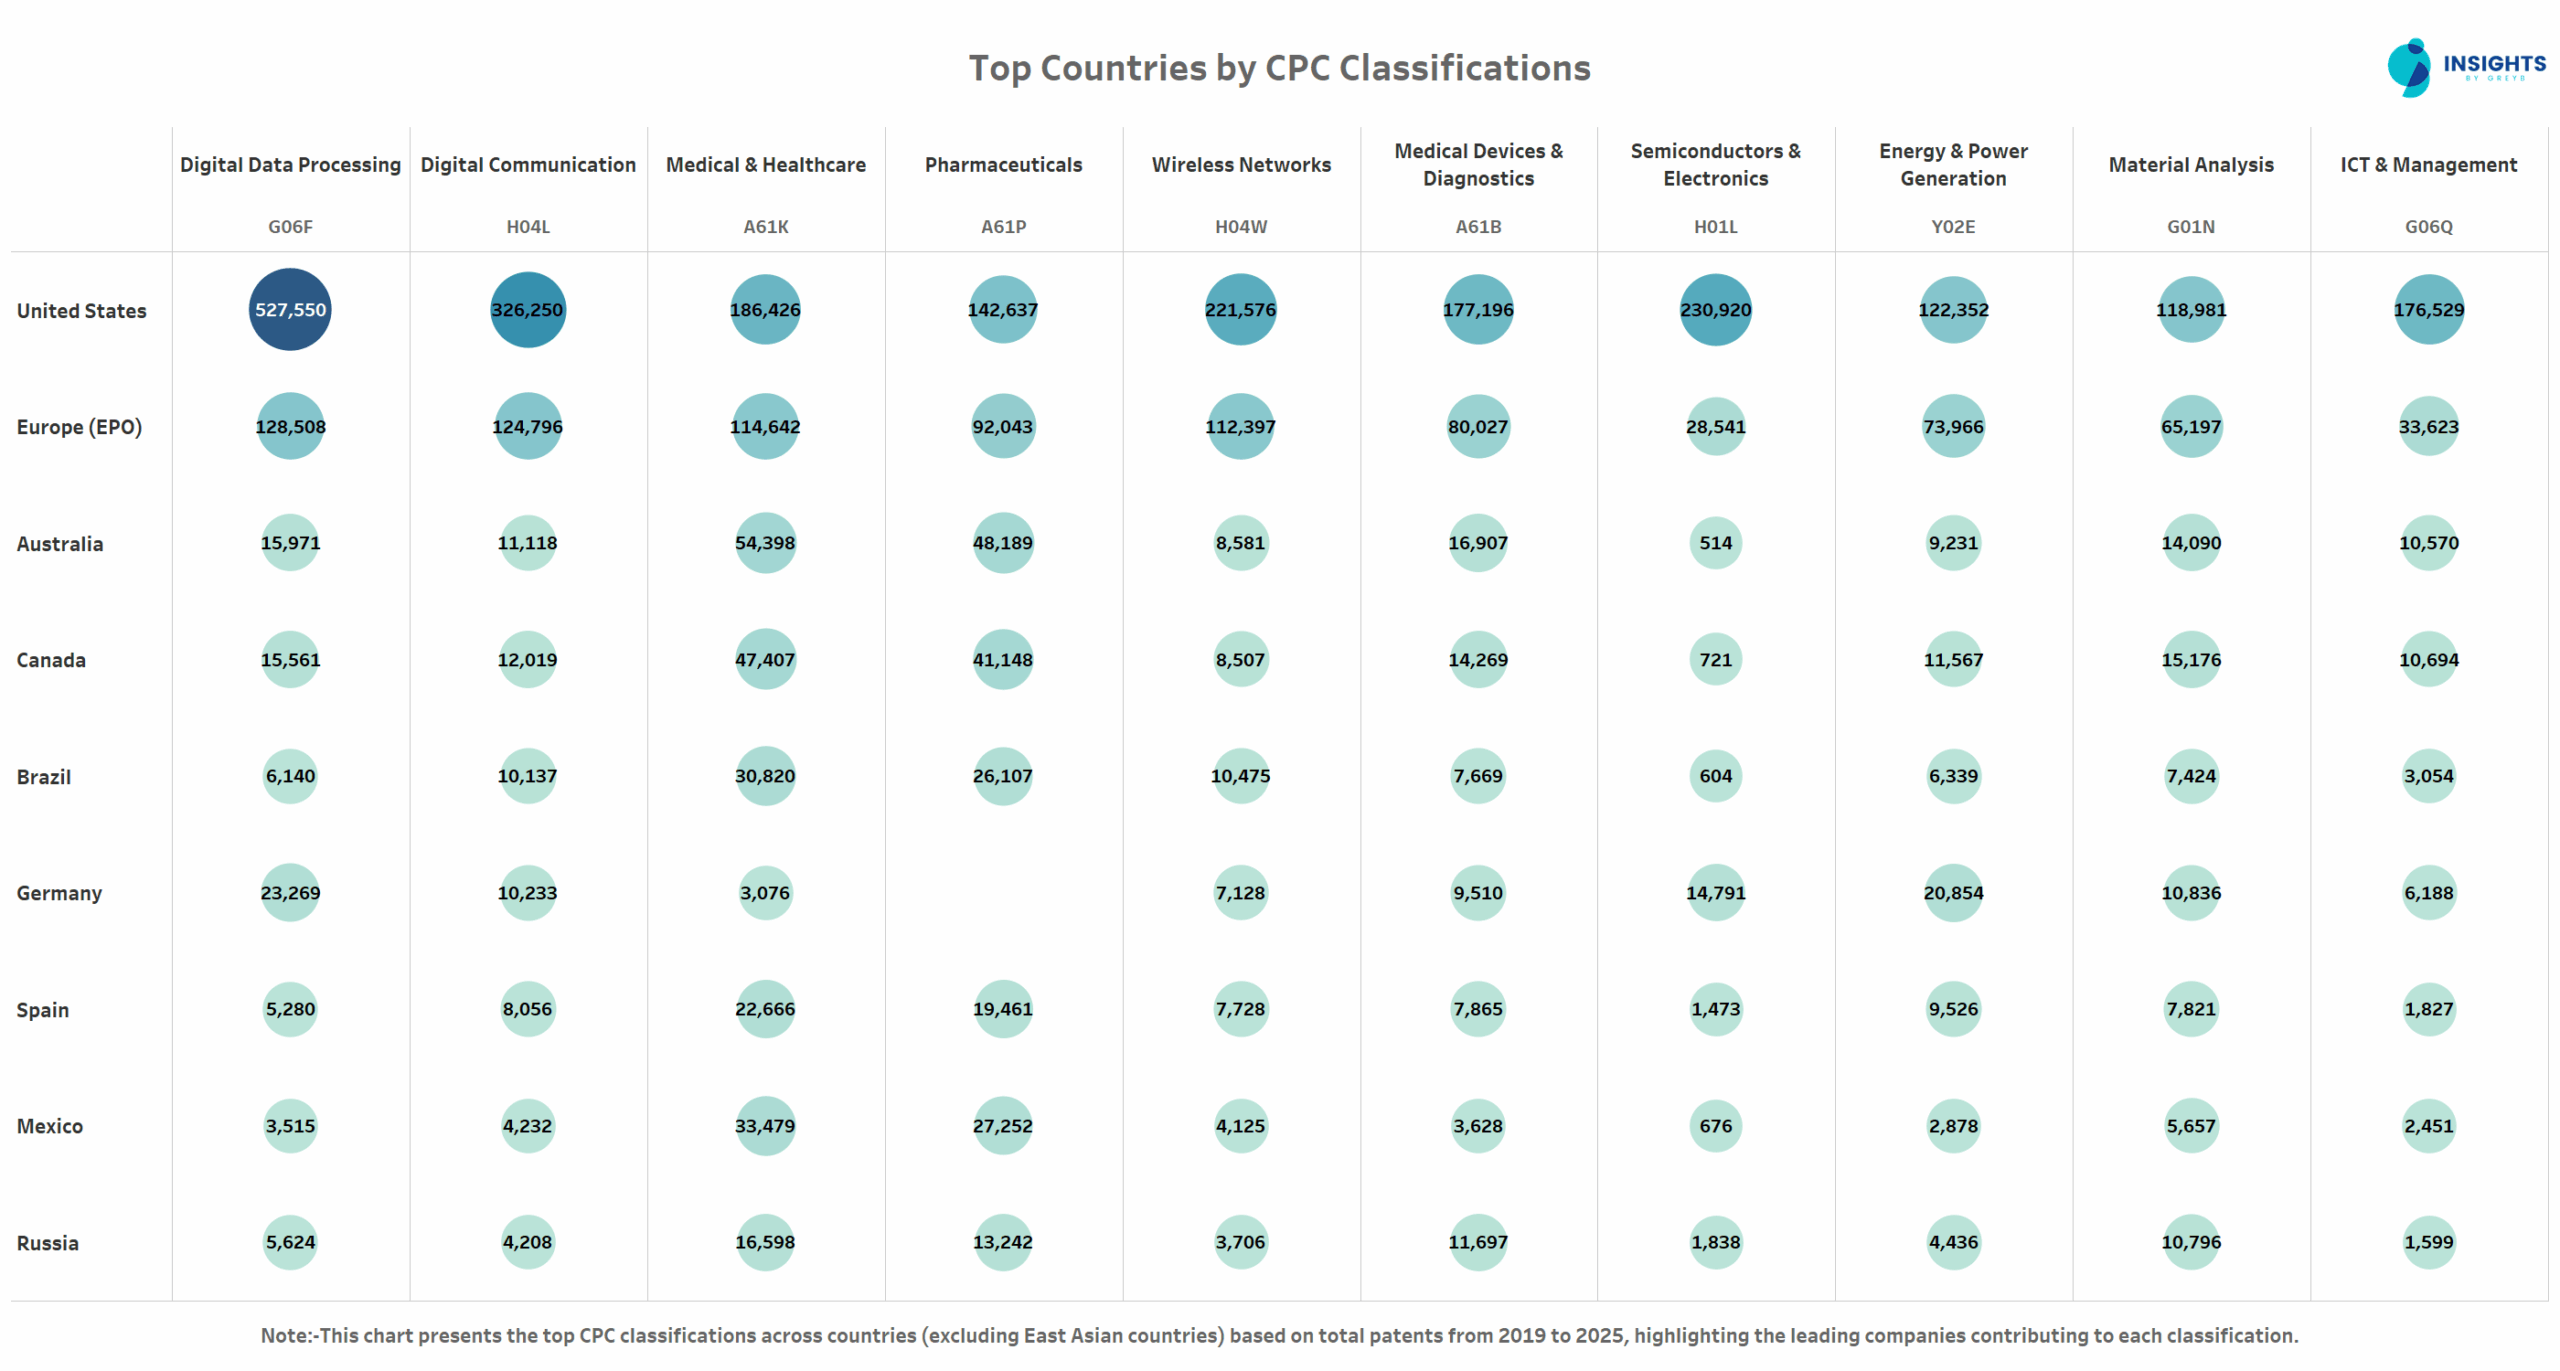
As the global patent landscape evolves, the focus is shifting toward technologies that not only shape industries but also influence entire economies. Digital Data Processing (G06F), Medical & Healthcare (A61K) and Digital Communication (H04L) are leading the charge in innovation, with the United States maintaining a commanding position in these sectors. The US is particularly strong in Digital Data Processing, showcasing its prowess in AI, cloud computing and big data all critical enablers of the digital transformation we are witnessing across industries.
Emerging markets like Mexico and Brazil are also carving out their niches in the medical and healthcare space, driven by their increasing healthcare infrastructure and demand for innovative solutions.
Which Companies Dominate Innovation in Key Technologies?
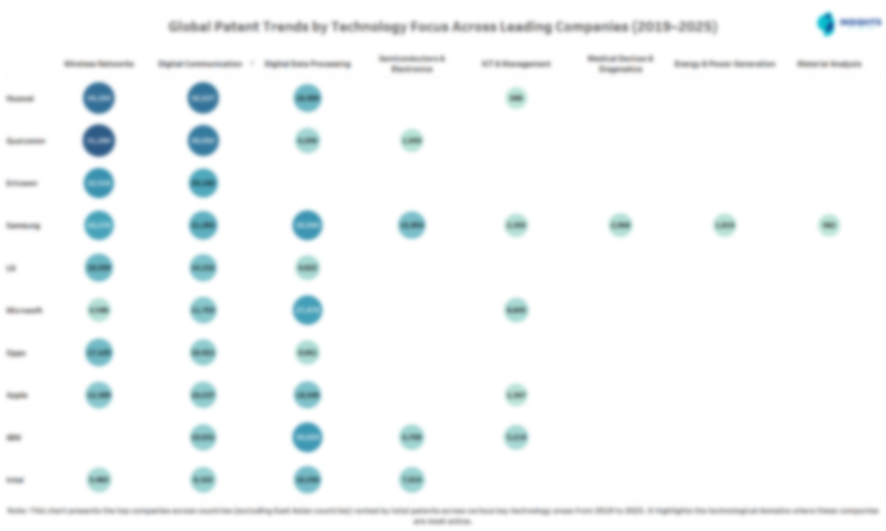
From AI breakthroughs to pharmaceutical advances, a handful of companies are shaping the future of every major technology domain. The report breaks down these leaders sector by sector mapping out their filings and focus areas.
Download the full report by filling out the form below.
Which Companies and Universities Are Driving Patent Partnerships?
This chart maps global patent collaboration networks between companies and academic institutions from 2019 to 2025, highlighting key research partnerships that drive innovation.
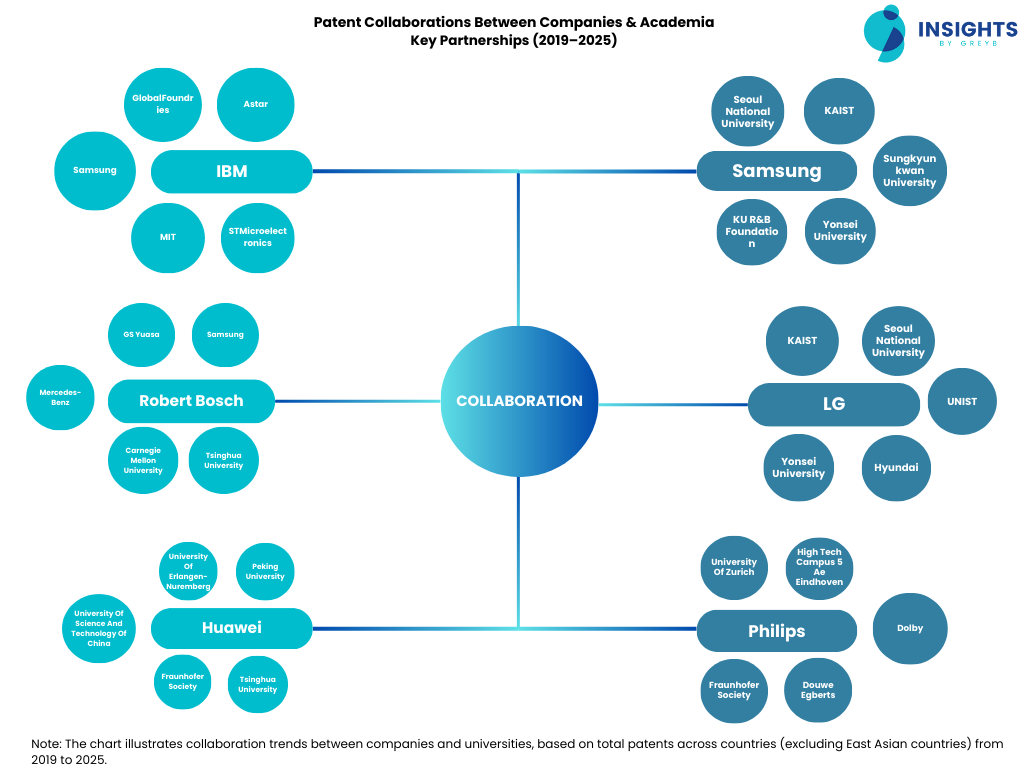
The importance of company-academia collaborations cannot be overstated in today’s innovation landscape. These alliances are instrumental in advancing cutting-edge technologies, with companies and universities pooling resources, knowledge and capabilities. The chart highlights how firms like IBM, Samsung, Bosch and Philips engage with academic institutions to drive patents and transform industries.
A standout example of this is Samsung Electronics’ collaboration with Seoul National University (SNU). Together, they pioneered the development of the graphene ball battery material a breakthrough that enhanced battery capacity by 45% and allowed for 5x faster charging. This innovation directly resulted from the integration of academic expertise in materials science with Samsung’s industrial R&D resources. The outcome? A patented innovation with transformative implications for consumer electronics, particularly in smartphones and electric vehicles.
How Has Patent Litigation & Licensing Changed Globally Over the Years?
The chart highlights a significant shift in patent enforcement trends, displaying a clear divergence between licensing deals and litigation cases from 2019 to 2025.
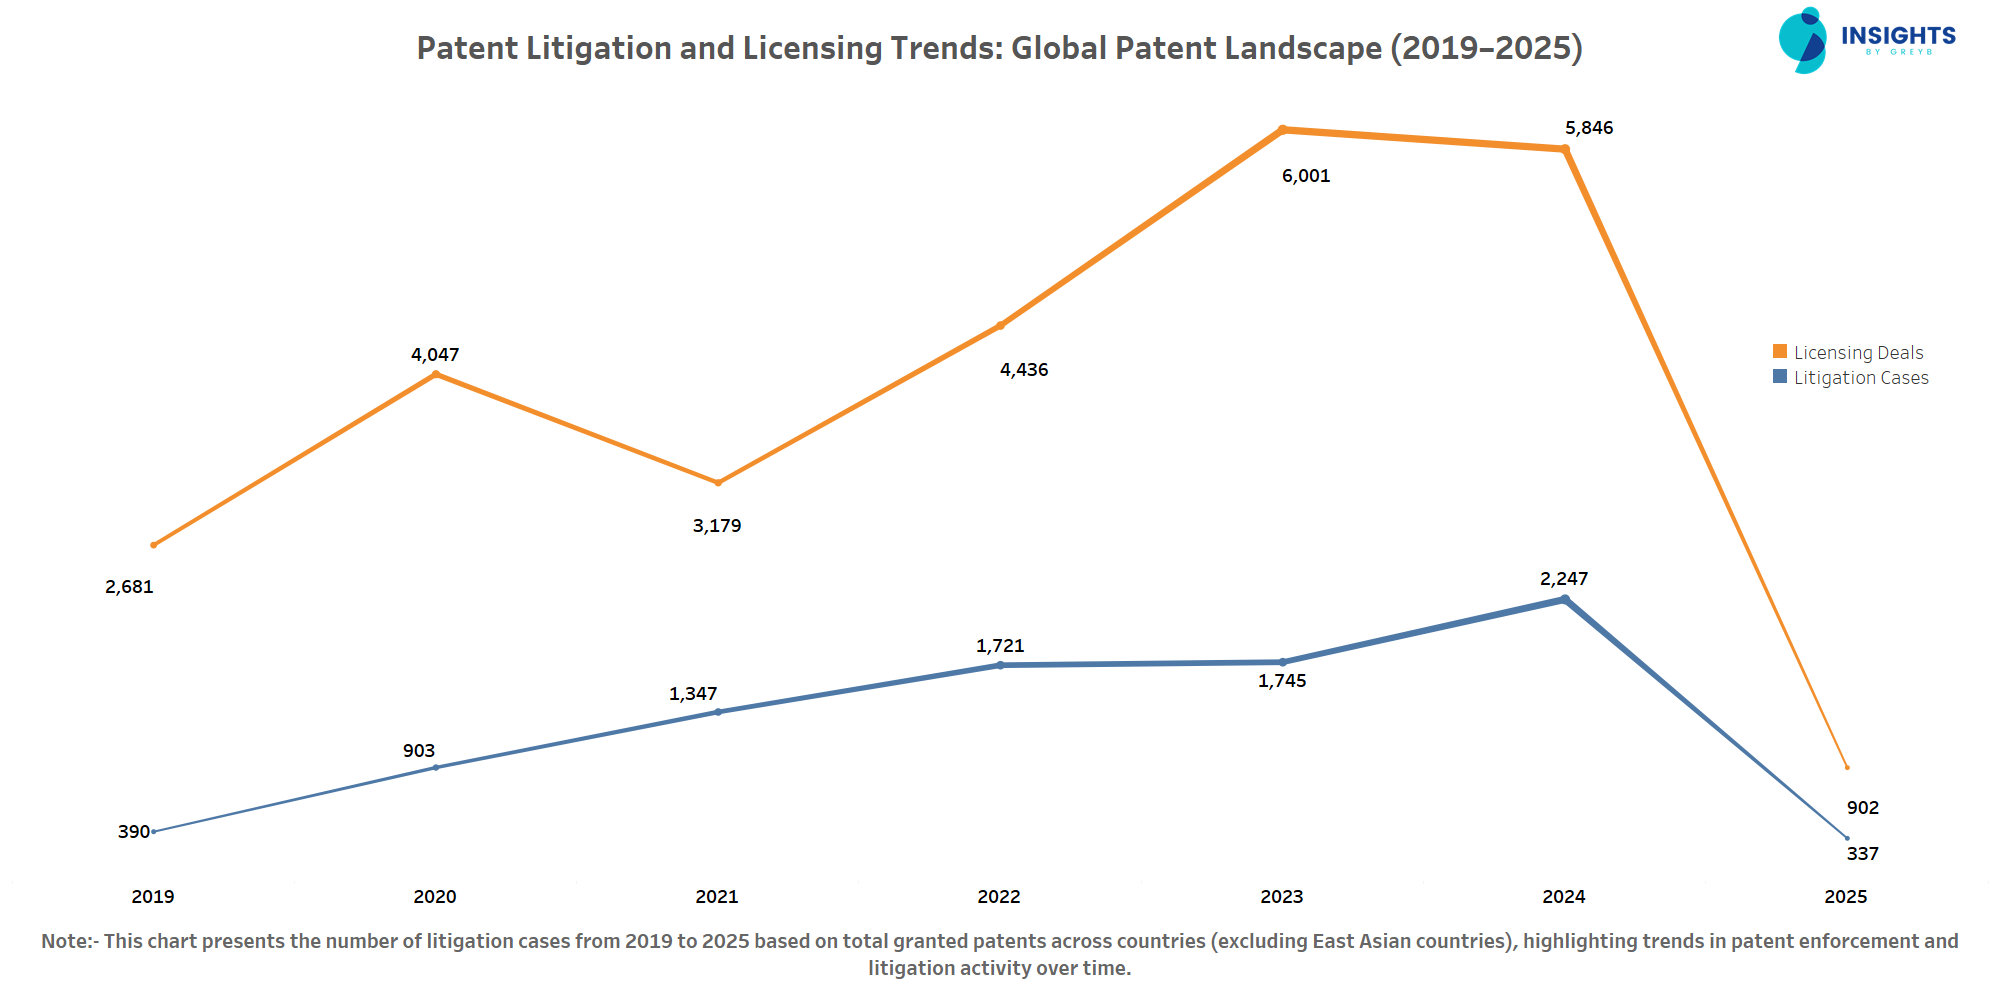
The chart reveals a notable shift in patent enforcement strategies between 2019 and 2025, with litigation cases rising sharply in 2024 while licensing deals dropped. This surge in litigation signals an increasing reliance on patents as defensive tools companies appear to be asserting their intellectual property rights more aggressively. Conversely, the decline in licensing deals in 2024 may indicate a strategic shift or market saturation, with fewer companies opting for licensing agreements or the expiration of temporary pandemic-era licensing initiatives.
Which Plaintiffs Are Most Active in Global Patent Litigation?
This chart highlights the top plaintiffs in patent litigation cases from 2019 to 2025. It showcases companies that have actively enforced their patents, either to protect innovations or engage in strategic lawsuits.
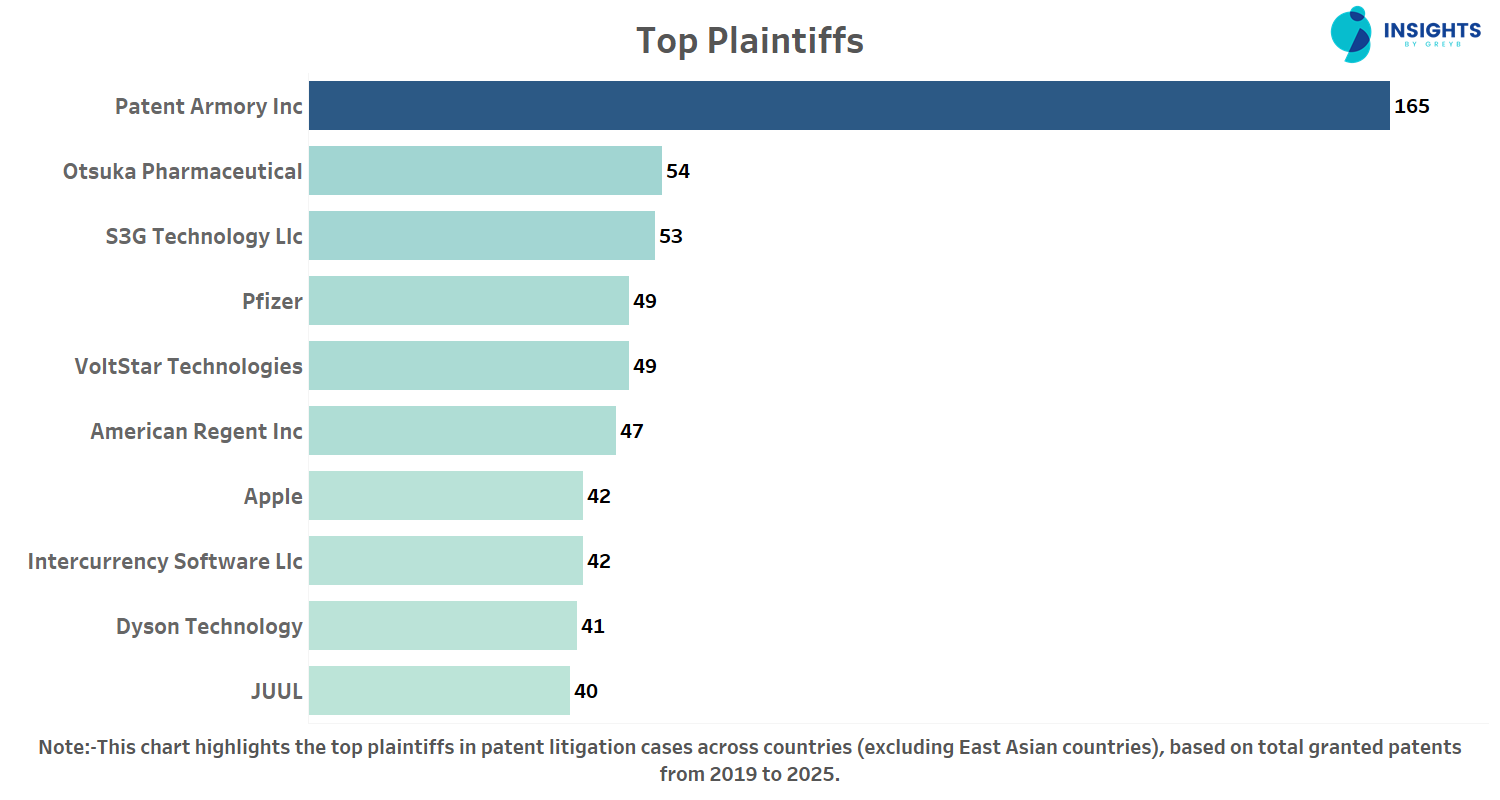
The top patent plaintiffs chart highlights the escalating role of NPEs (non-practicing entities) in the patent landscape. Patent Armory Inc, an NPE, leads with an impressive 165 cases, significantly outpacing operating companies. This underscores the growing litigation power of NPEs, who focus on monetizing patent portfolios rather than bringing products to market.
In contrast, leading pharmaceutical and technology companies such as Otsuka Pharmaceutical, Pfizer and Apple also feature prominently. These companies demonstrate how active industry players are increasingly relying on patents as strategic assets in highly competitive sectors such as healthcare and consumer technology.
What Patent Trends Reveal?
As we look toward 2025 and beyond, the global patent landscape reflects an era of unprecedented technological transformation. With East Asia particularly China, Japan and South Korea at the forefront, innovation is reaching new heights, especially in fields such as AI, biotechnology and clean energy. The United States and Europe, while still strongholds of invention, are witnessing the rise of emerging markets like India and Brazil, which are beginning to leave their own marks in the innovation ecosystem.
What stands out from the past six years of patent activity is the clear shift toward digitalization, sustainability, and advanced manufacturing technologies. Patents in AI-driven healthcare, energy storage solutions and green technologies are set to accelerate, with companies and academic institutions increasingly collaborating to drive breakthroughs. The future promises a surge in competition, especially as key players like Samsung, LG and Huawei double down on their investments in telecom, smart electronics and EV technologies.
Yet, with this growth comes a challenge: the intensification of patent litigation. As innovation races forward, companies are using IP not just as a shield, but as a sword in an increasingly competitive global market. Non-practicing entities (NPEs) are also becoming key players in this landscape, asserting their influence over how patents are litigated and monetized.
The years ahead will likely see an explosion of IP filings across emerging sectors, with AI, quantum technologies and sustainability taking center stage. But as we continue to push the boundaries of what’s possible, it is crucial that businesses and innovators remain agile, navigating the shifting currents of intellectual property and legal strategies that will define the future of global competition.
What you’ve read here is just a fraction of the story. The Global Patent and Innovation Leadership Report pulls together insights from 55 million+ patents across 150+ countries, giving you the clearest view yet of how innovation is shifting across the globe.Download the Report
Split into two parts, one focused on countries outside East Asia, and the other dedicated to East Asia’s powerhouse nations, the report reveals patterns you won’t want to miss:
- Which 100 companies are setting the pace of innovation, and how their patent count have changed since 2019.
- Why 2024 marked a turning point in global litigation, with NPEs leading the charge.
- How company–university collaborations triggered breakthroughs like Samsung and Seoul National University’s graphene-ball battery.
- The patents with the highest global impact, cited thousands of times across sectors.
- Insights into how companies secure patents in their strongest markets first — Apple, Qualcomm, and Bosch reinforcing home advantage before expanding abroad.
- …and much more that simply can’t fit into a single article.