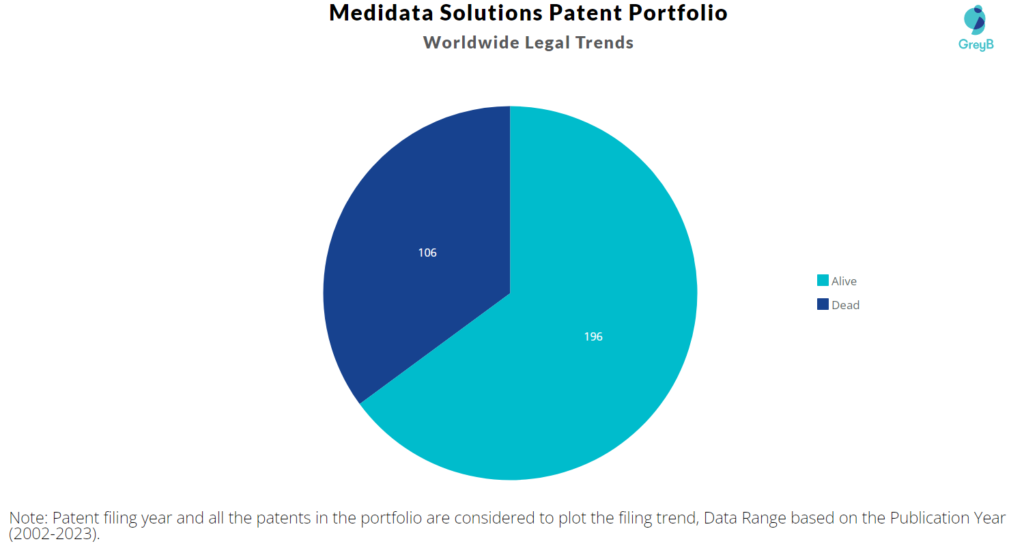
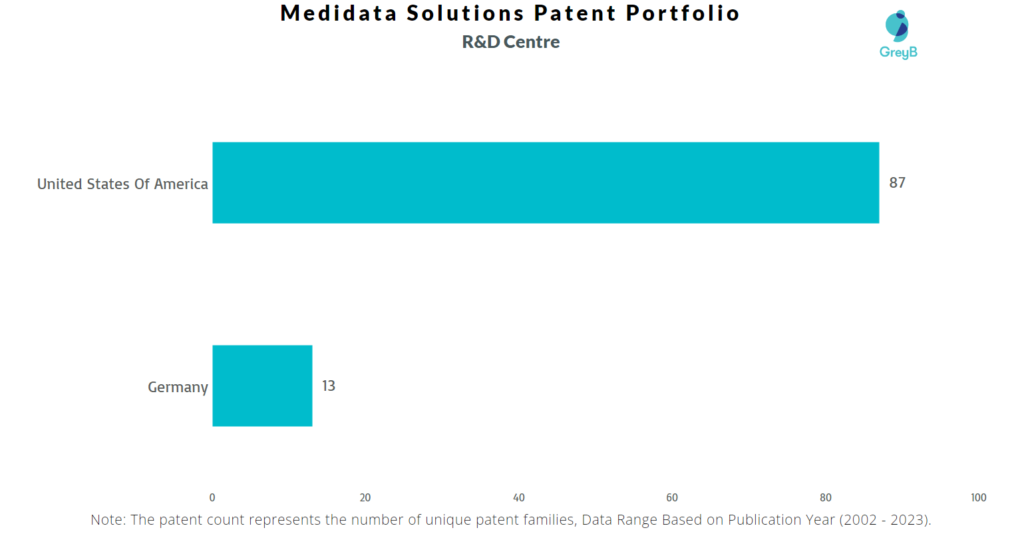
Medidata Solutions has a total of 302 patents globally, out of which 178 have been granted. Of these 302 patents, more than 64% patents are active. The United States of America is where Medidata Solutions has filed the maximum number of patents, followed by Europe and Japan. Parallelly, the United States of America seems to be the main focused R&D centre and also is the origin country of Medidata Solutions.
Medidata Solutions was founded in the year 1999. The Company provides hosted clinical development solutions. The Company offers solutions that include a comprehensive platform that integrates electronic data capture (EDC) with a clinical data management system (CDMS) in a single solution that replaces traditional paper-based methods of capturing and managing clinical data.
Do read about some of the most popular patents of Medidata Solutions which have been covered by us in this article and also you can find Medidata Solutions patents information, the worldwide patent filing activity and its patent filing trend over the years, and many other stats over Medidata Solutions patent portfolio.
How many patents does the founder and the CEO of Medidata Solutions have?
The founder Glen de Vrieshas has 0 patent and CEO Pascal Daloz has 0 patent.
How many patents does Medidata Solutions have?
Medidata Solutions has a total of 302 patents globally. These patents belong to 100 unique patent families. Out of 302 patents, 196 patents are active.
How Many Patents did Medidata Solutions File Every Year?
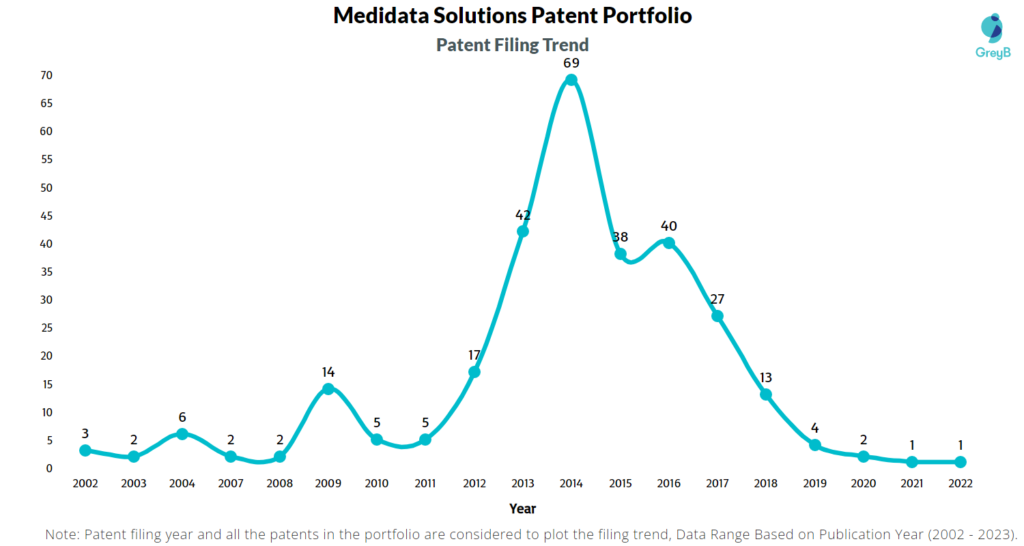
Are you wondering why there is a drop in patent filing for the last two years? It is because a patent application can take up to 18 months to get published. Certainly, it doesn’t suggest a decrease in the patent filing.
| Year of Patents Filing or Grant | Medidata Solutions Applications Filed | Medidata Solutions Patents Granted |
| 2022 | 1 | 6 |
| 2021 | 1 | 10 |
| 2020 | 2 | 15 |
| 2019 | 4 | 33 |
| 2018 | 13 | 21 |
| 2017 | 27 | 36 |
| 2016 | 40 | 18 |
| 2015 | 38 | 16 |
| 2014 | 69 | 10 |
| 2013 | 42 | 9 |
| 2012 | 17 | 1 |
| 2011 | 5 | – |
How many Medidata Solutions patents are Alive/Dead?
How Many Patents did Medidata Solutions File in Different Countries?
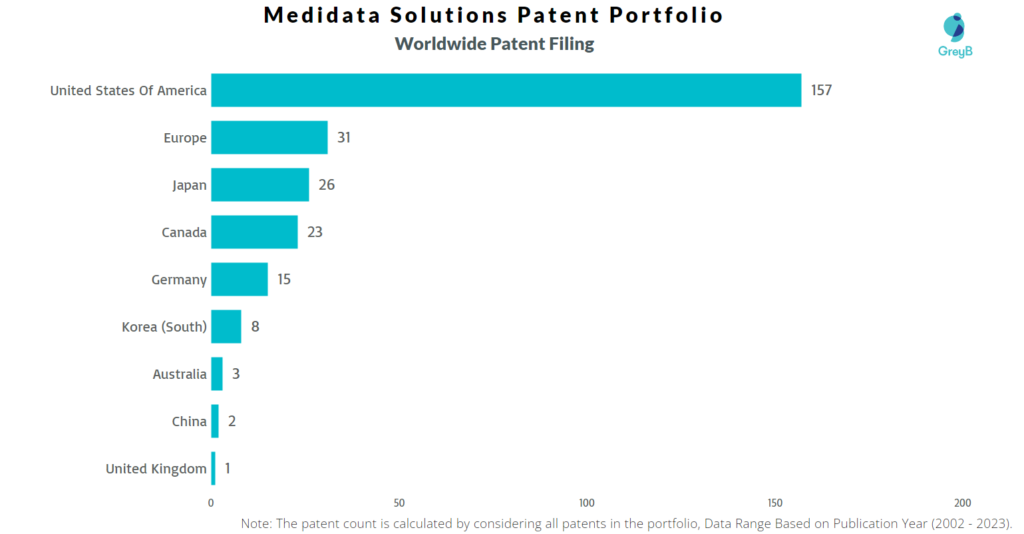
Countries in which Medidata Solutions Filed Patents
| Country | Patents |
| United States Of America | 157 |
| Europe | 31 |
| Japan | 26 |
| Canada | 23 |
| Germany | 15 |
| Korea (South) | 8 |
| Australia | 3 |
| China | 2 |
| United Kingdom | 1 |
Where are Research Centres of Medidata Solutions Patents Located?
10 Best Medidata Solutions Patents
US8097926B2 is the most popular patent in the Medidata Solutions portfolio. It has received 208 citations so far from companies like Thync, Mc10 and Samsung.
Below is the list of 10 most cited patents of Medidata Solutions:
| Publication Number | Citation Count |
| US8097926B2 | 208 |
| US8389862B2 | 157 |
| US8536667B2 | 140 |
| US20030065669A1 | 124 |
| US8372726B2 | 114 |
| US8886334B2 | 104 |
| US9119533B2 | 92 |
| US9168094B2 | 81 |
| US9159635B2 | 65 |
| US9289132B2 | 63 |
How many inventions of other companies were rejected due to Medidata Solutions patents?
The statistics below share strategic R&D insights. It tells the companies that were trying to protect inventions similar to Medidata Solutions invention. They couldn’t because Medidata Solutions had protected those before them.
Examiners at the USPTO referred 79 Medidata Solutions patents in 880 rejections (35 USC § 102 or 35 USC § 103 types).
The top citing companies in the Medidata Solutions patent portfolio are IBM, Biosense Webster and Chita Inc.
List of the Companies who’s Patents were rejected citing Medidata Solutions –
| Company | Number of Patent Applications that faced Rejection Citing Medidata Solutions Patents | Number of Rejections (102 & 103) |
| IBM | 18 | 40 |
| Biosense Webster | 9 | 30 |
| Chita Inc | 9 | 24 |
| Mc10 | 8 | 15 |
| Microsoft | 6 | 11 |
| Intel | 5 | 8 |
| Boston Scientific Scimed | 4 | 14 |
| Polytechnique | 4 | 8 |
| Boe Technology | 4 | 8 |
| Oracle | 4 | 12 |
Count of 102 and 103 Type Rejections based on Medidata Solutions Patents
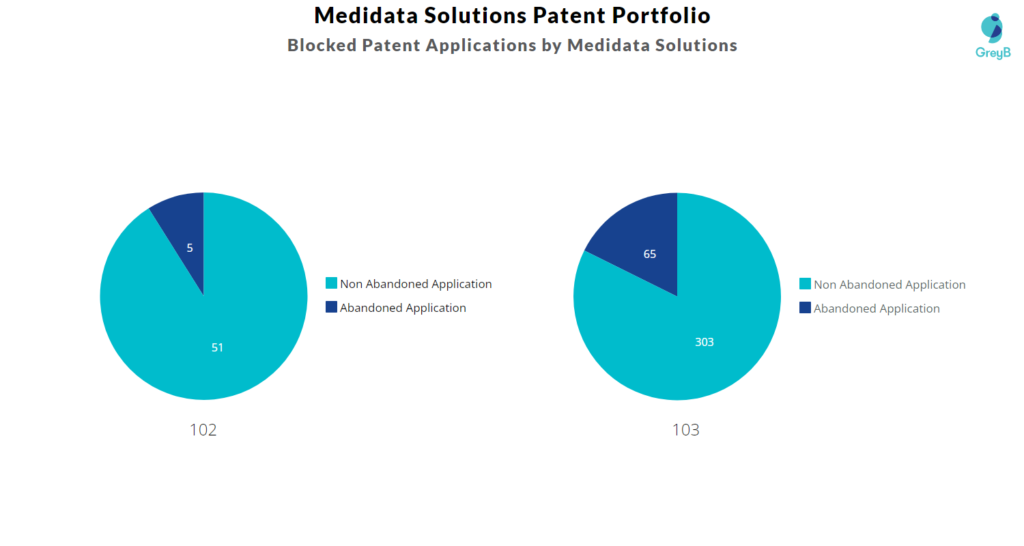
Top Medidata Solutions Patents used in Rejecting Most Patent Applications
| Patent Number | Count of Rejected Applications |
| US8097926B2 | 45 |
| US8886334B2 | 29 |
| US9119533B2 | 15 |
| US20030065669A1 | 14 |
| US8504380B2 | 13 |
| US10846424B2 | 12 |
| US8536667B2 | 12 |
| US9289132B2 | 11 |
| US9706647B2 | 11 |
| US10024743B2 | 11 |
| US8389862B2 | 10 |
| US9702839B2 | 9 |
| US9545216B2 | 9 |
| US8372726B2 | 9 |
| US10477354B2 | 8 |
What Percentage of Medidata Solutions US Patent Applications were Granted?
Medidata Solutions (Excluding its subsidiaries) has filed 148 patent applications at USPTO so far (Excluding Design and PCT applications). Out of these 105 have been granted leading to a grant rate of 73.94%.
Below are the key stats of Medidata Solutions patent prosecution at the USPTO.

Which Law Firms Filed Most US Patents for Medidata Solutions?
| Law Firm | Total Applications | Success Rate |
| Medidata Solutions | 79 | 87.18% |
| Steptoe & Johnson | 46 | 65.85% |
| Hoffmann & Baron | 19 | 42.11% |
| Sterne Kessler Goldstein & Fox | 2 | 100.00% |
| Fenwick & West | 1 | 0.00% |
| Reed Smith | 1 | 0.00% |
