Mitsui & Co has a total of 2194 patents globally, out of which 1176 have been granted. Of these 2194 patents, more than 34% patents are active. Japan is where Mitsui & Co has filed the maximum number of patents, followed by South Africa and USA. Parallelly, Japan seems to be the main focused R&D center and is also the origin country of Mitsui & Co.
Mitsui & Co was founded in 1947 by Takashi Masuda and Tatsuzo Minakami. Mitsui & Co is a general trading company. The Company has operating groups including iron and steel, non-ferrous metals, machinery, chemicals, foods, energy, textiles, and general merchandise. Mitsui also operates real estate and overseas development projects. As of February 2022, Mitsui & Co has a market cap of $43.57 Billion.
Do read about some of the most popular patents of Mitsui & Co which have been covered by us in this article and also you can find Mitsui & Co patents information, the worldwide patent filing activity and its patent filing trend over the years, and many other stats over Mitsui & Co patent portfolio.
How many patents does the CEO of Mitsui & Co have?
The CEO, Tatsuo Yasunaga have 0 patents.
How many patents does Mitsui & Co have?
Mitsui & Co has a total of 2194 patents globally. These patents belong to 1480 unique patent families. Out of 2194 patents, 766 patents are active.
How many Mitsui & Co patents are Alive/Dead?
Worldwide Patents

Patent Families

How Many Patents did Mitsui & Co File Every Year?

Are you wondering why there is a drop in patent filing for the last two years? It is because a patent application can take up to 18 months to get published. Certainly, it doesn’t suggest a decrease in the patent filing.
| Year of Patents Filing or Grant | Mitsui & Co Applications Filed | Mitsui & Co Patents Granted |
| 2011 | 117 | 87 |
| 2012 | 140 | 106 |
| 2013 | 83 | 67 |
| 2014 | 93 | 79 |
| 2015 | 82 | 60 |
| 2016 | 68 | 50 |
| 2017 | 62 | 37 |
| 2018 | 70 | 32 |
| 2019 | 65 | 28 |
| 2020 | 71 | 29 |
| 2021 | 73 | 34 |
| 2022 | 9 | 2 |
How Many Patents did Mitsui & Co File in Different Countries?

Countries in which Mitsui & Co Filed Patents
| Country | Patents |
| Japan | 1084 |
| South Africa | 165 |
| United States Of America | 125 |
| Europe | 112 |
| Germany | 100 |
| China | 82 |
| Korea (South) | 54 |
| Australia | 43 |
| Canada | 32 |
| Taiwan | 26 |
| Italy | 26 |
| Austria | 25 |
| Spain | 23 |
| India | 18 |
| Poland | 15 |
| Brazil | 14 |
| Russian Federation | 13 |
| Indonesia | 8 |
| Portugal | 7 |
| Singapore | 7 |
| Slovenia | 7 |
| Malaysia | 6 |
| Denmark | 5 |
| Philippines | 5 |
| Hong Kong (S.A.R.) | 4 |
| Czech Republic | 4 |
| United Kingdom | 4 |
| Hungary | 3 |
| Mongolia | 3 |
| France | 3 |
| Viet Nam | 3 |
| Mexico | 3 |
| Ukraine | 2 |
| Egypt | 2 |
| Saudi Arabia | 1 |
| Eurasian Patent Organization | 1 |
| Turkey | 1 |
| Belarus | 1 |
| Ecuador | 1 |
| Croatia | 1 |
| Cyprus | 1 |
| Argentina | 1 |
Where are Research Centers of Mitsui & Co Patents Located?

10 Best Mitsui & Co Patents
US20060263588A1 is the most popular patent in the Mitsui & Co portfolio. It has received 100 citations so far from companies like LG, Covestro and Top Nanosys Inc.
Below is the list of 10 most cited patents of Mitsui & Co:
| Publication Number | Citation Count |
| US20060263588A1 | 100 |
| JP2002056099A | 92 |
| US6857006B1 | 89 |
| US6471976B1 | 87 |
| JP2007174903A | 76 |
| JP2009089966A | 70 |
| US6437974B1 | 66 |
| JP2005232115A | 64 |
| US6197808B1 | 61 |
| JP2007089942A | 58 |
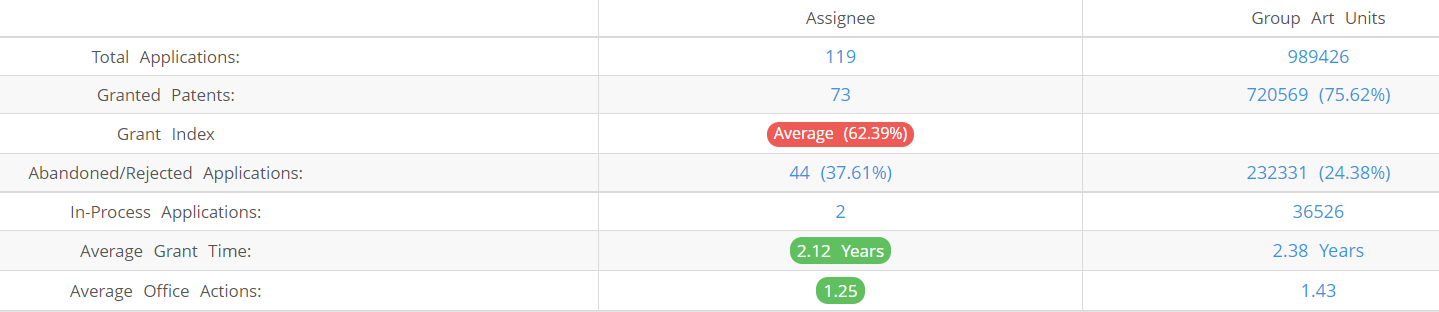
What Percentage of Mitsui & Co US Patent Applications were Granted?
Mitsui & Co (Excluding its subsidiaries) has filed 119 patent applications at USPTO so far (Excluding Design and PCT applications). Out of these 73 have been granted leading to a grant rate of 62.39%.
Below are the key stats of Mitsui & Co patent prosecution at the USPTO.
Which Law Firms Filed Most US Patents for Mitsui & Co?
| Law Firm | Total Applications | Success Rate |
| Sughrue Mion | 19 | 15.79% |
| Robic | 16 | 100.00% |
| Cooper & Dunham | 5 | 40.00% |
| Foley & Lardner | 4 | 75.00% |
| Osha Bergman Watanabe & Burton | 4 | 25.00% |
| Wells St John | 4 | 0.00% |
| Bakerhostetler | 3 | 33.33% |
| Buchanan Ingersoll & Rooney | 3 | 100.00% |
| Parmelee Miller Welsh & Kratz | 6 | 66.67% |
| Randall Danskin | 3 | 100.00% |
EXCLUSIVE INSIGHTS COMING SOON!
What are Mitsui & Co‘s key innovation segments?
What Technologies are Covered by Mitsui & Co?
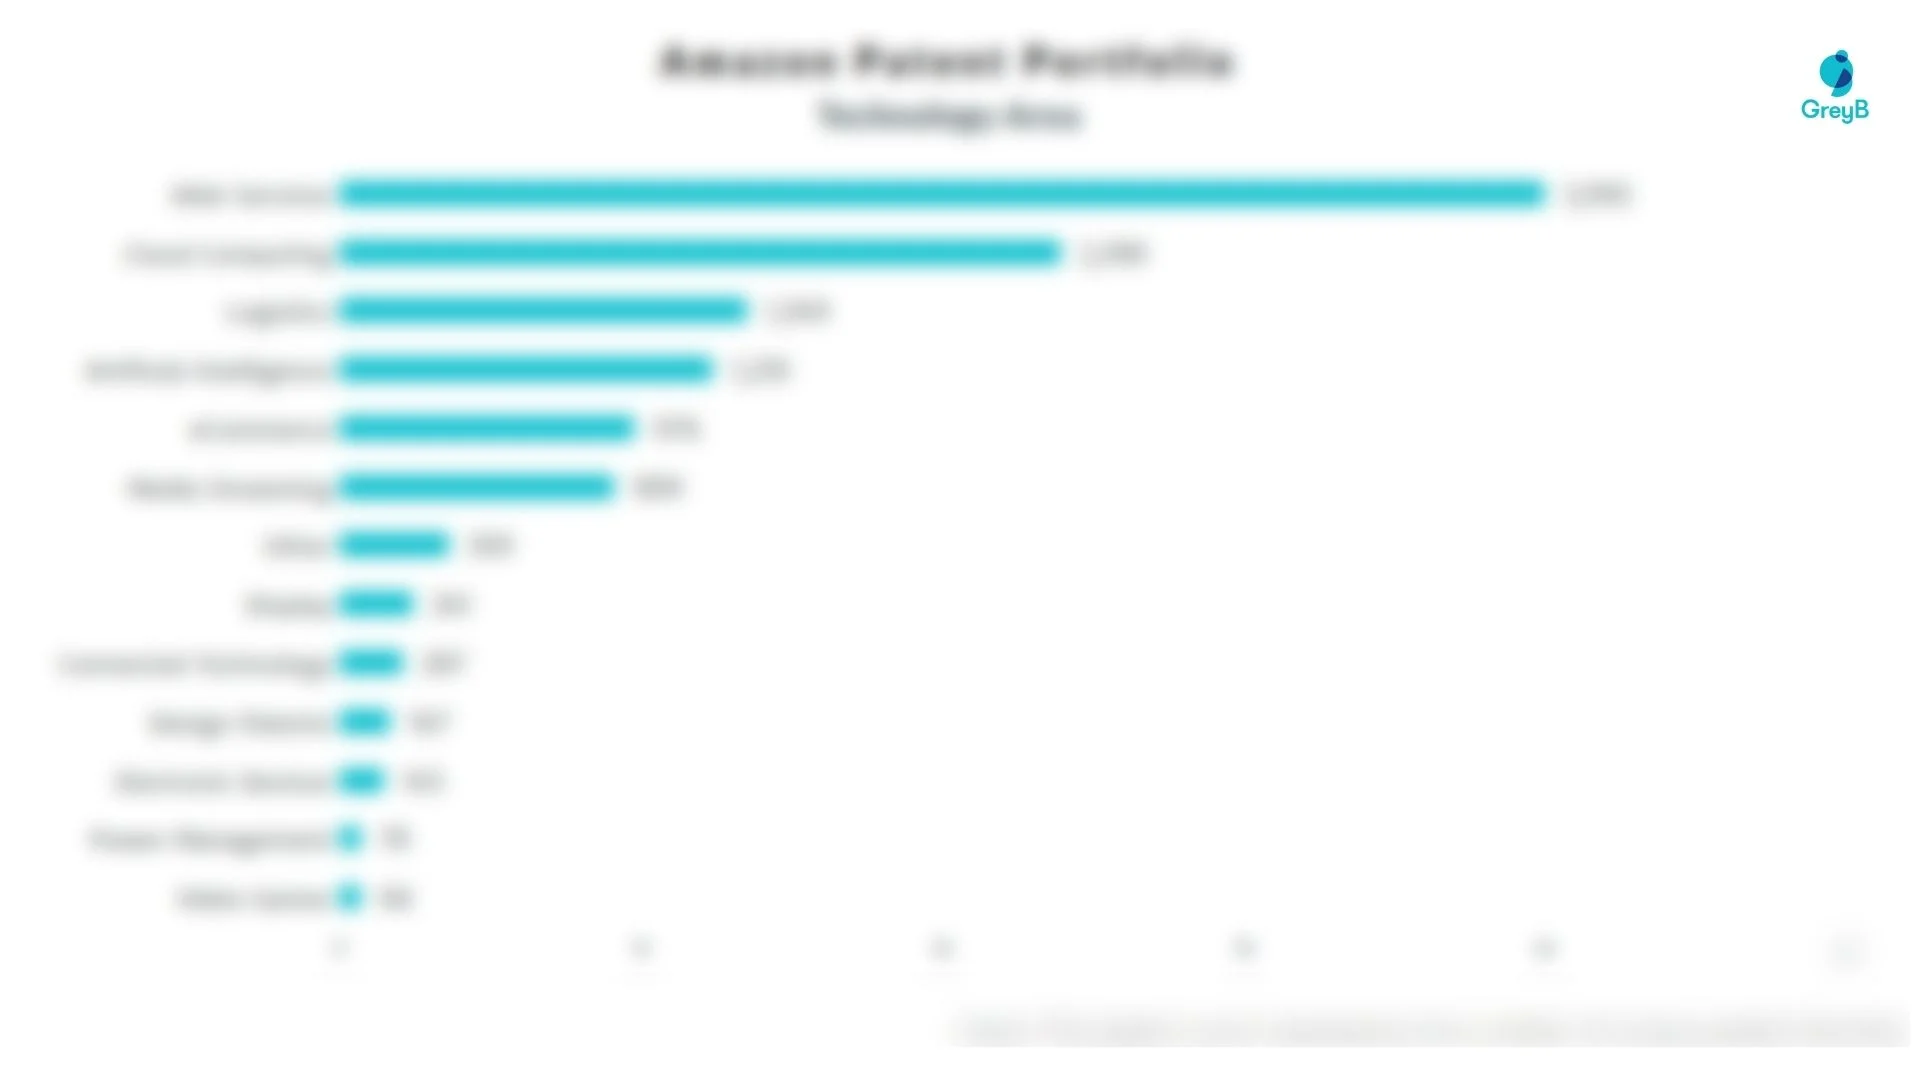
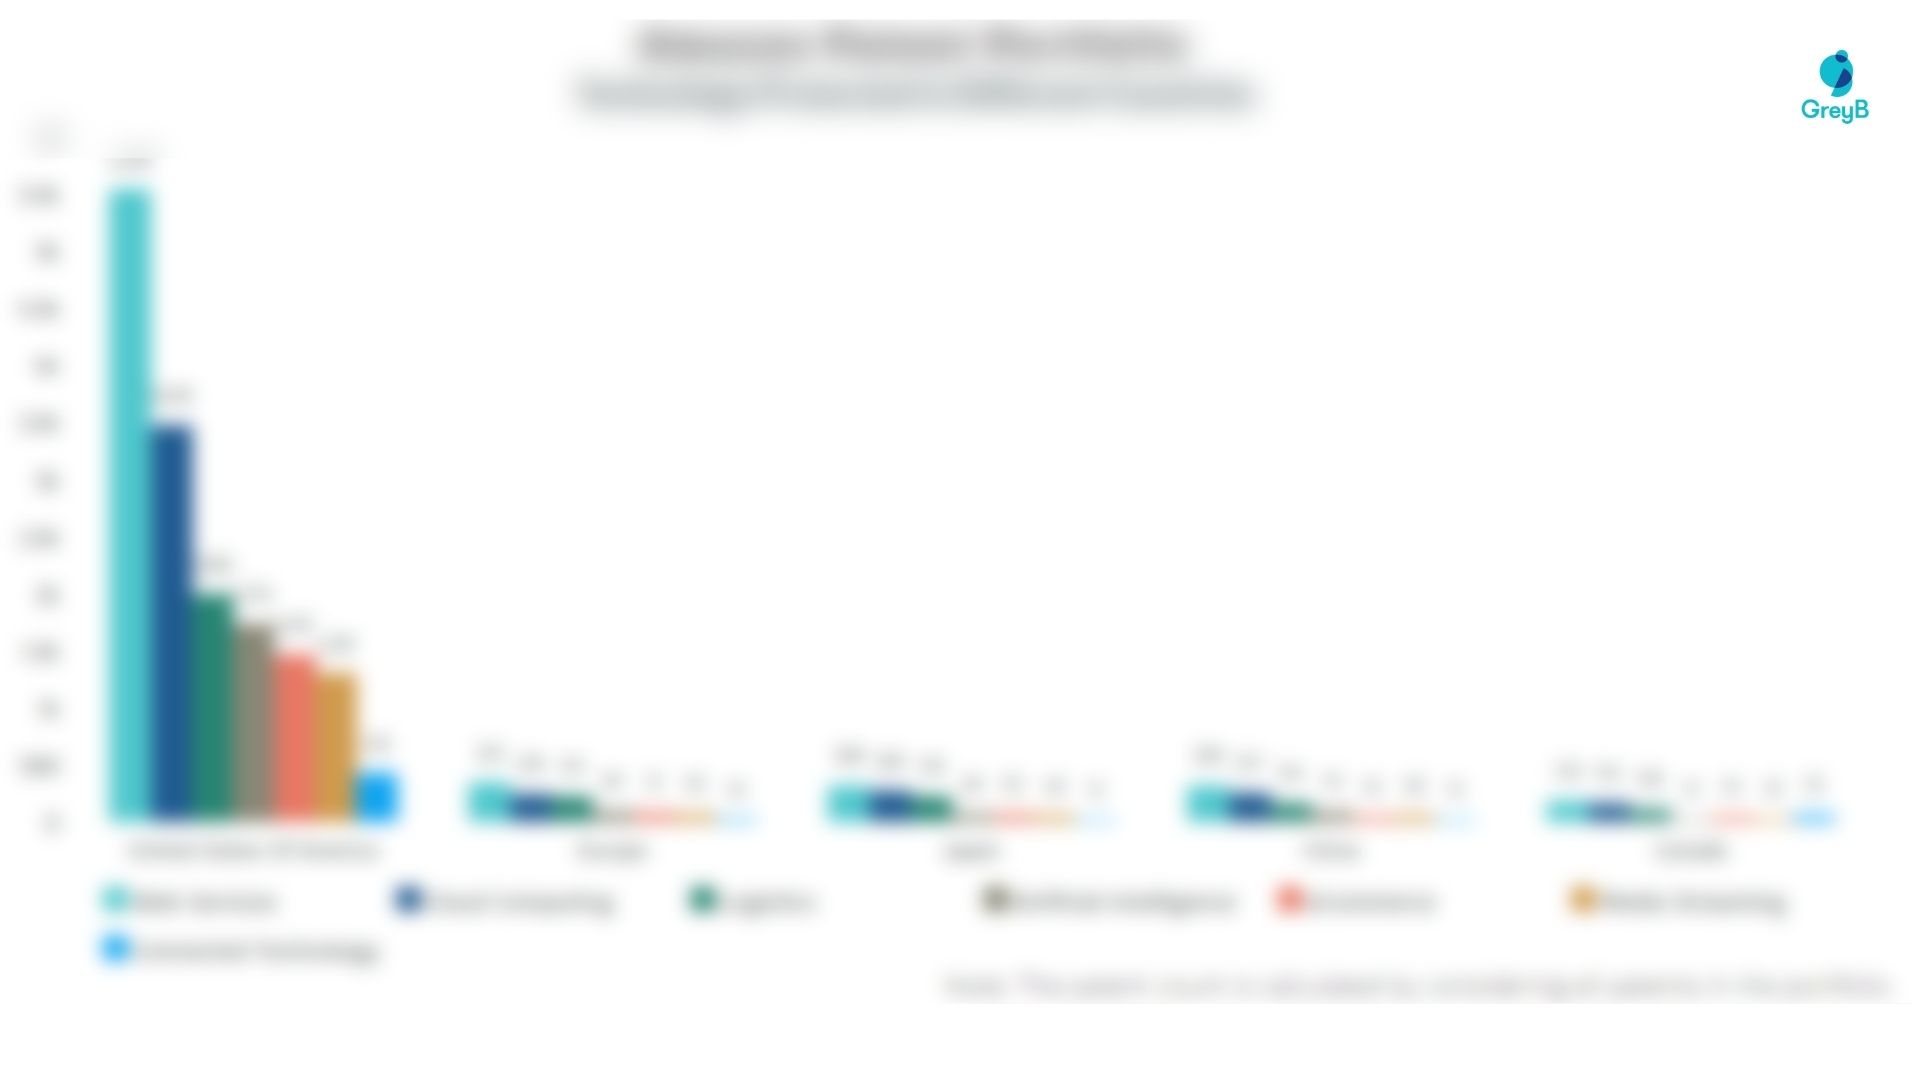
The chart below distributes patents filed by Mitsui & Co in different countries on the basis of the technology protected in patents. It also represents the markets where Mitsui & Co thinks it’s important to protect particular technology inventions.
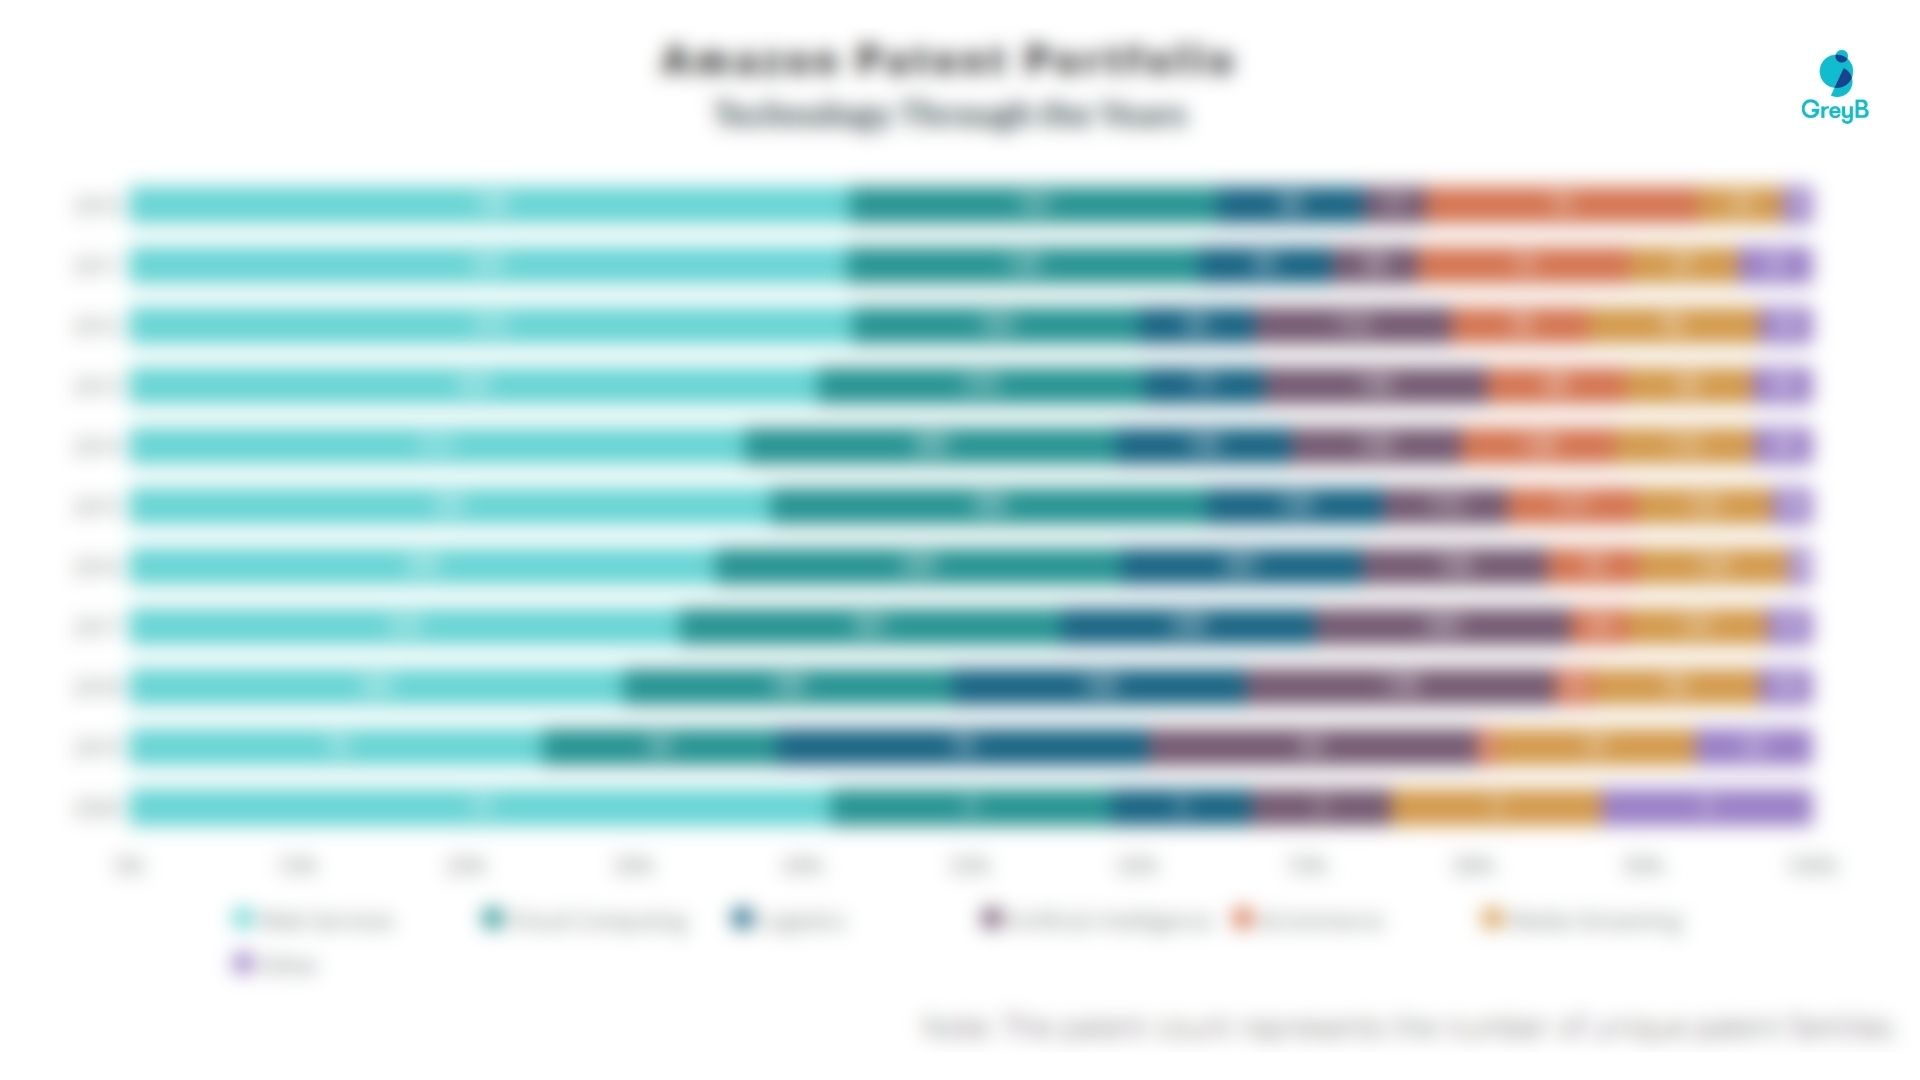
R&D Focus: How Mitsui & Co search focus changed over the years?
EXCLUSIVE INSIGHTS COMING SOON!
Interested in knowing about the areas of innovation that are being protected by Mitsui & Co?