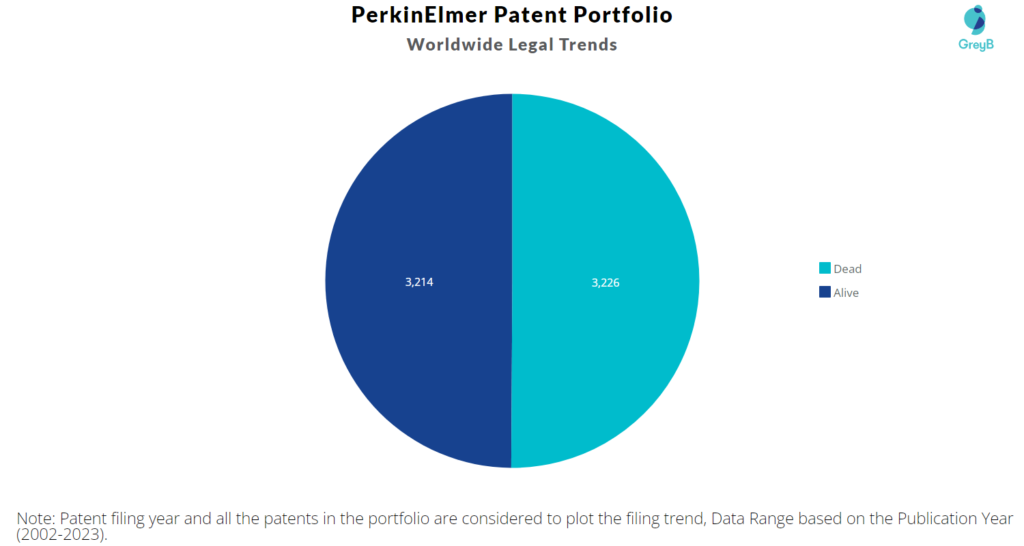
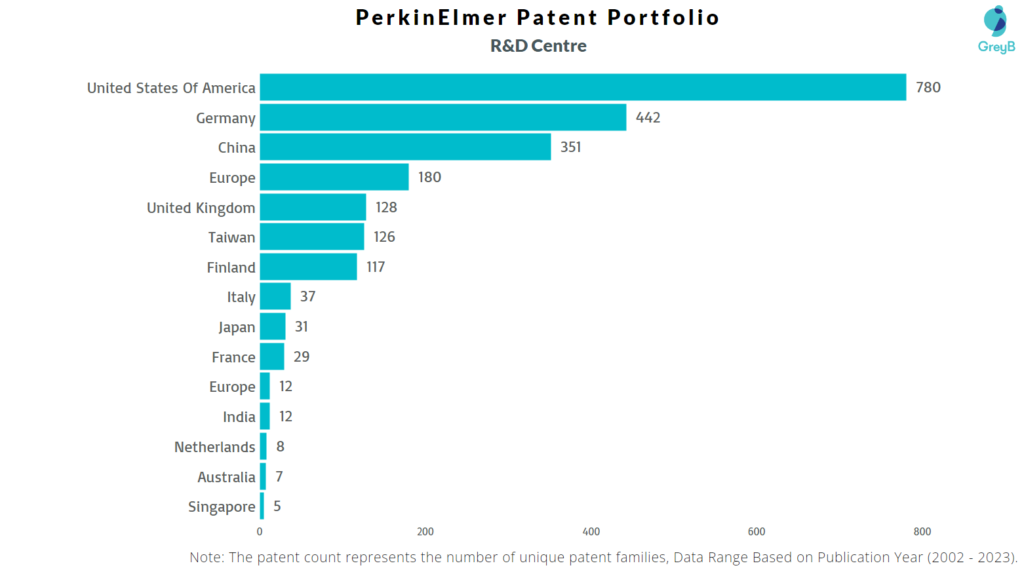
PerkinElmer has a total of 6440 patents globally, out of which 3508 have been granted. Of these 6440 patents, more than 49% patents are active. United States of America is where PerkinElmer has filed the maximum number of patents, followed by Europe and China. Parallelly, United States of America seems to be the main focused R&D centre and also is the origin country of PerkinElmer.
PerkinElmer was founded in the year 1937. PerkinElmer serves the diagnostics, research, environmental, industrial, and laboratory services markets with technology, services, and solutions. Optoelectronics, analytical tools, image detecting systems, fluid containment goods, genetic screening and drug discovery equipment, and other items are among the company’s offerings. As of April 2023, PerkinElmer has a market cap of $16.25 Billion.
Do read about some of the most popular patents of PerkinElmer which have been covered by us in this article and also you can find PerkinElmer patents information, the worldwide patent filing activity and its patent filing trend over the years, and many other stats over PerkinElmer patent portfolio.
How many patents does the founder and the CEO of PerkinElmer have?
The founder Richard Scott Perkin have 0 patents and CEO Prahlad Singh have 10 patents.
How many patents does PerkinElmer have?
PerkinElmer has a total of 6440 patents globally. These patents belong to 2309 unique patent families. Out of 6440 patents, 3214 patents are active.
How Many Patents did PerkinElmer File Every Year?
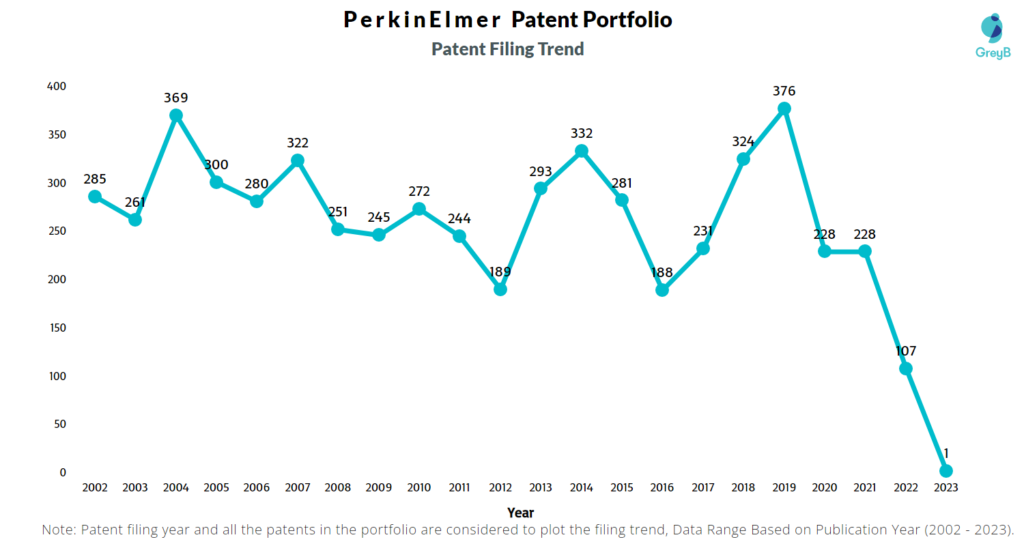
Are you wondering why there is a drop in patent filing for the last two years? It is because a patent application can take up to 18 months to get published. Certainly, it doesn’t suggest a decrease in the patent filing.
| Year of Patents Filing or Grant | PerkinElmer Applications Filed | PerkinElmer Patents Granted |
| 2023 | 1 | 48 |
| 2022 | 107 | 217 |
| 2021 | 228 | 273 |
| 2020 | 228 | 262 |
| 2019 | 376 | 237 |
| 2018 | 324 | 206 |
| 2017 | 231 | 180 |
| 2016 | 188 | 191 |
| 2015 | 281 | 149 |
| 2014 | 332 | 178 |
| 2013 | 293 | 151 |
| 2012 | 189 | 164 |
| 2011 | 244 | 149 |
How many PerkinElmer patents are Alive/Dead?
How Many Patents did PerkinElmer File in Different Countries?
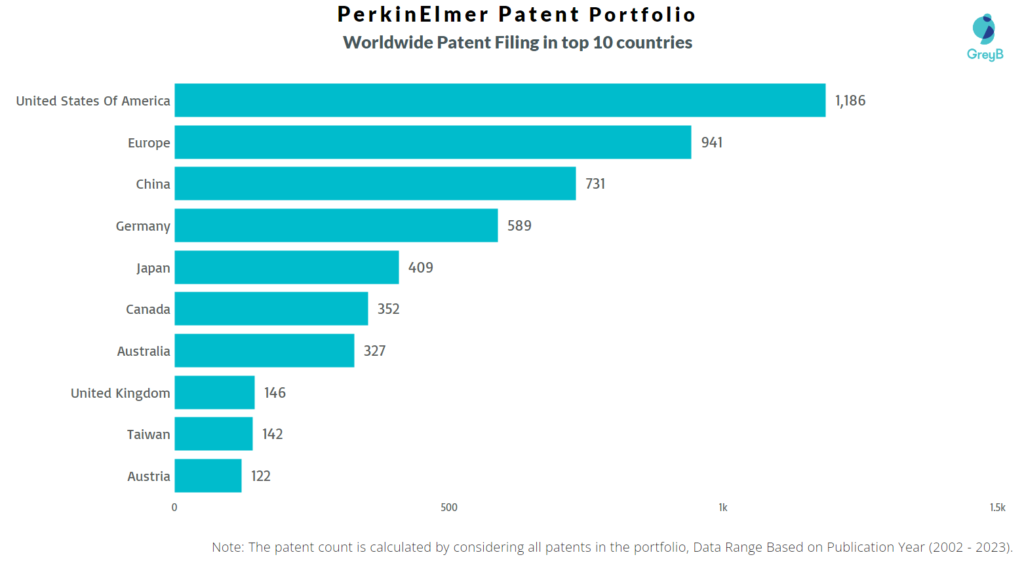
Countries in which PerkinElmer Filed Patents
| Country | Patent |
| United States Of America | 1186 |
| Europe | 941 |
| China | 731 |
| Germany | 589 |
| Japan | 409 |
| Canada | 352 |
| Australia | 327 |
| United Kingdom | 146 |
| Taiwan | 142 |
| Austria | 122 |
| Spain | 104 |
| Korea (South) | 82 |
| India | 82 |
| Finland | 76 |
| Singapore | 69 |
| Brazil | 58 |
| Denmark | 46 |
| Hong Kong (S.A.R.) | 41 |
| Italy | 34 |
| Poland | 34 |
| France | 26 |
| Israel | 19 |
| Mexico | 14 |
| Norway | 13 |
| Hungary | 11 |
| South Africa | 10 |
| Portugal | 10 |
| Slovenia | 6 |
| Netherlands | 5 |
| Lithuania | 4 |
| Viet Nam | 4 |
| Malaysia | 3 |
| Russia | 3 |
| New Zealand | 3 |
| Indonesia | 2 |
| Turkey | 2 |
| Czech Republic | 2 |
| Croatia | 2 |
| United Arab Emirates | 1 |
| Bulgaria | 1 |
| Slovakia | 1 |
| Argentina | 1 |
| Estonia | 1 |
| Philippines | 1 |
Where are Research Centres of PerkinElmer Patents Located?
10 Best PerkinElmer Patents
US6409832B2 is the most popular patent in the PerkinElmer portfolio. It has received 563 citations so far from companies like Syrrx, Searete and Fluidigm Corporation.
Below is the list of 10 most cited patents of PerkinElmer:
| Publication Number | Citation Count |
| US6409832B2 | 563 |
| US6480389B1 | 416 |
| US20090325276A1 | 312 |
| US6338942B2 | 248 |
| US6383754B1 | 242 |
| US6488896B2 | 222 |
| US20090061450A1 | 198 |
| US6431212B1 | 193 |
| US6743399B1 | 186 |
| US6674525B2 | 184 |
How many inventions of other companies were rejected due to PerkinElmer patents?
The statistics below share strategic R&D insights. It tells the companies that were trying to protect inventions similar to PerkinElmer invention. They couldn’t because PerkinElmer had protected those before them.
Examiners at the USPTO referred 462 PerkinElmer patents in 2863 rejections (35 USC § 102 or 35 USC § 103 types).
The top citing companies in the PerkinElmer patent portfolio are Geneasys, Samsung and Life Technologies.
List of the Companies whose Patents were rejected citing PerkinElmer –
| Company | Number of Patent Applications that faced Rejection Citing PerkinElmer Patents | Number of Rejections (102 & 103) |
| Geneasys | 89 | 129 |
| Samsung | 23 | 80 |
| Life Technologies | 10 | 59 |
| Visen Medical | 10 | 34 |
| Philips | 6 | 21 |
| National Science Foundation | 6 | 10 |
| Wallac Oy | 6 | 20 |
| Bio-Rad Laboratories | 6 | 19 |
| Hitachi | 6 | 20 |
| Olympus Corporation | 5 | 10 |
Count of 102 and 103 Type Rejections based on PerkinElmer Patents
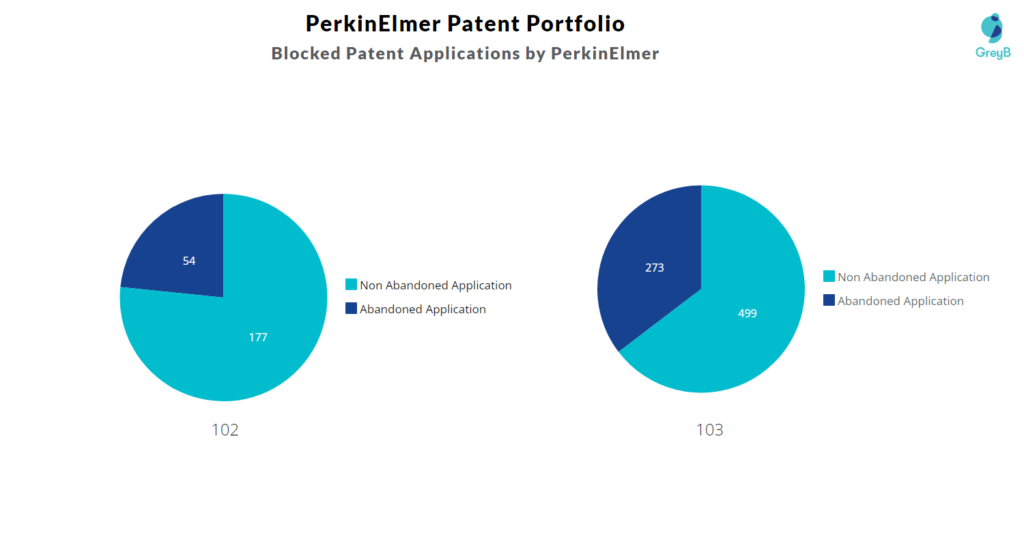
Top PerkinElmer Patents used in Rejecting Most Patent Applications
| Patent Number | Count of Rejected Applications |
| US20090325276A1 | 76 |
| US8110392B2 | 24 |
| US10064584B2 | 22 |
| US8222023B2 | 18 |
| US20020003001A1 | 14 |
| US6835960B2 | 13 |
| US7763453B2 | 13 |
| US6743399B1 | 11 |
| US20070081340A1 | 8 |
| US20070178529A1 | 8 |
| US7233391B2 | 8 |
| US20020087275A1 | 8 |
| US20050056855A1 | 7 |
| US20020036271A1 | 7 |
| US7988841B2 | 7 |
