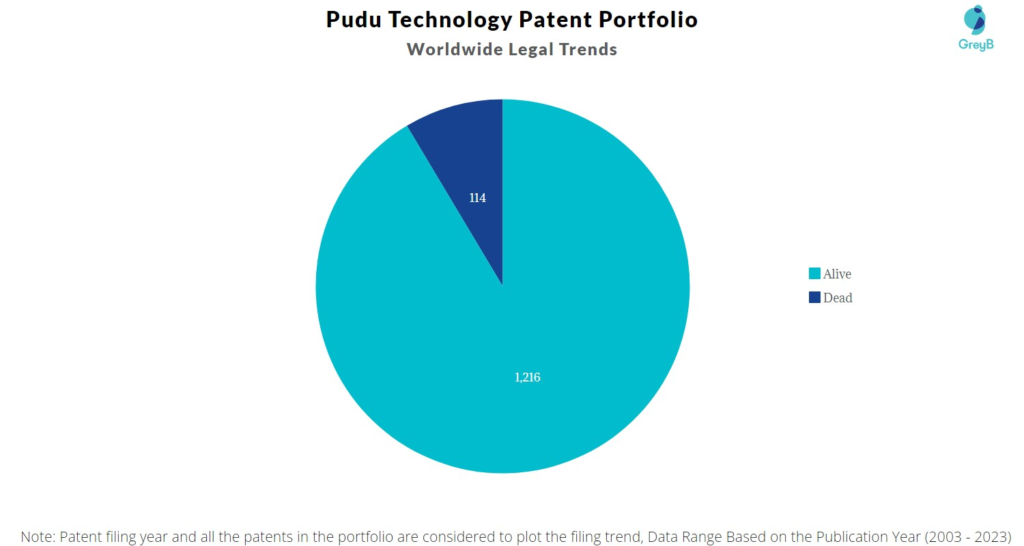
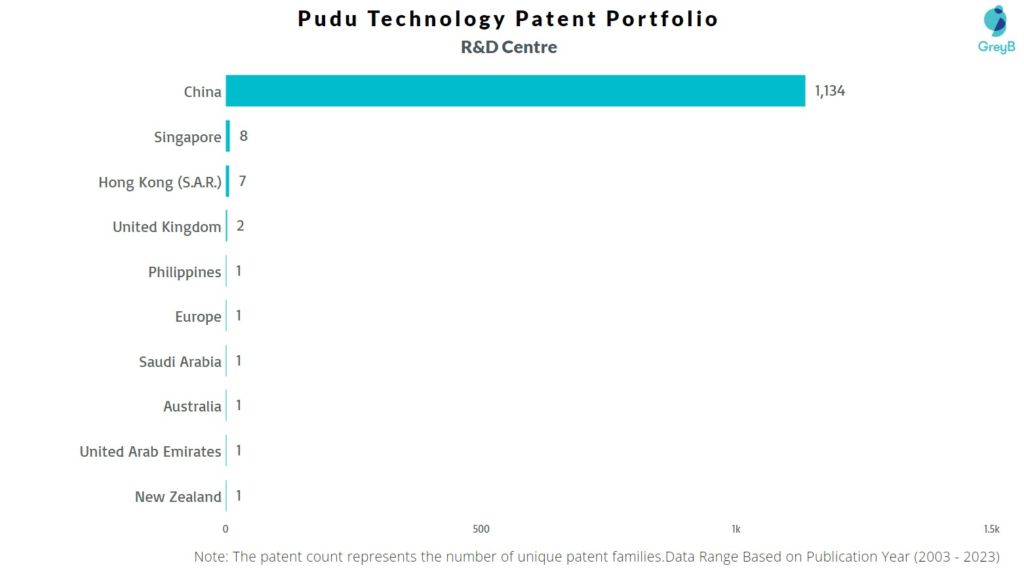
Pudu Technology has a total of 1330 patents globally, out of which 877 have been granted. Of these 1330 patents, more than 91% patents are active. China is where Pudu Technology has filed the maximum number of patents, followed by United Kingdom and Europe. Parallelly, China seems to be the main focused R&D centre and also is the origin country of Pudu Technology.
Pudu Technology was founded in the year 2016. The Company manufactures and distributes commercial service robots. The Company produces distribution robots, disinfection robots and other equipment.
Do read about some of the most popular patents of Pudu Technology which have been covered by us in this article and also you can find Pudu Technology patents information, the worldwide patent filing activity and its patent filing trend over the years, and many other stats over Pudu Technology patent portfolio.
How many patents does the founder and the CEO of Pudu Technology have?
The founder and CEO Tao Zhang has 0 patent.
How many patents does Pudu Technology have?
Pudu Technology has a total of 1330 patents globally. These patents belong to 1157 unique patent families. Out of 1330 patents, 1216 patents are active.
How Many Patents did Pudu Technology File Every Year?
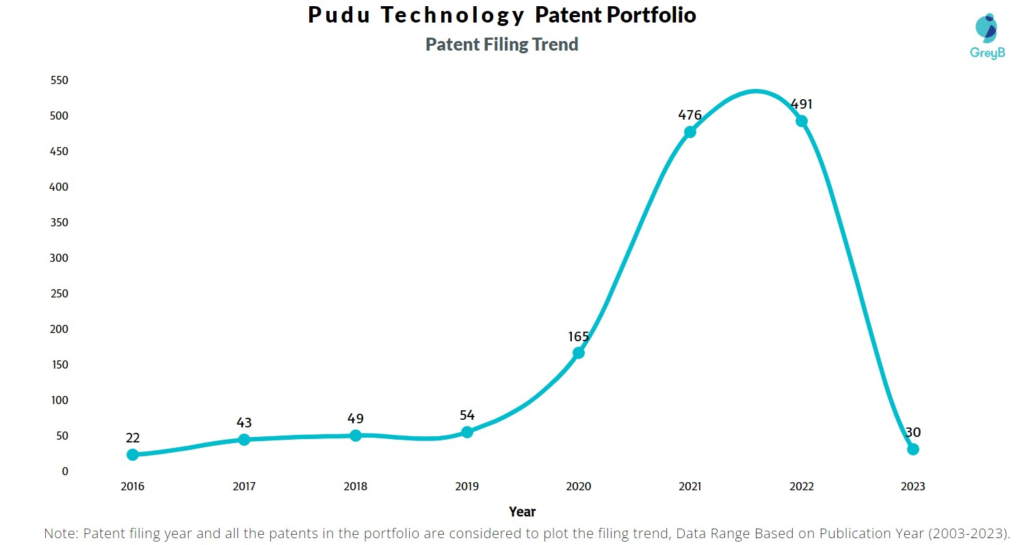
Are you wondering why there is a drop in patent filing for the last two years? It is because a patent application can take up to 18 months to get published. Certainly, it doesn’t suggest a decrease in the patent filing.
| Year of Patents Filing or Grant | Pudu Technology Applications Filed | Pudu Technology Patents Granted |
| 2023 | 30 | 171 |
| 2022 | 491 | 438 |
| 2021 | 476 | 158 |
| 2020 | 165 | 43 |
| 2019 | 54 | 39 |
| 2018 | 49 | 18 |
| 2017 | 43 | 9 |
| 2016 | 22 | 1 |
How many Pudu Technology patents are Alive/Dead?
How Many Patents did Pudu Technology File in Different Countries?
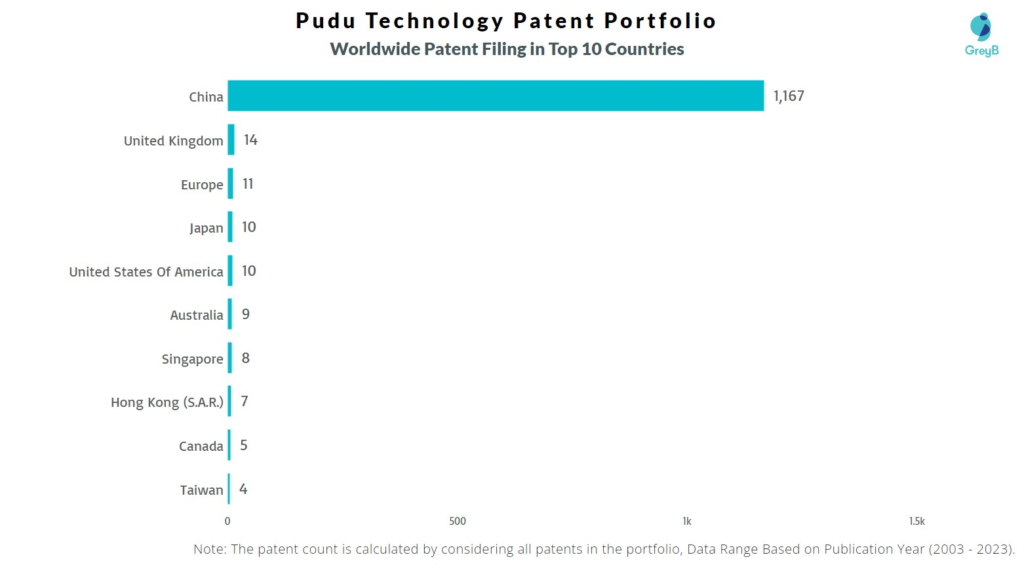
Countries in which Pudu Technology Filed Patents
| Country | Patents |
| China | 1167 |
| United Kingdom | 14 |
| Europe | 11 |
| Japan | 10 |
| United States Of America | 10 |
| Australia | 9 |
| Singapore | 8 |
| Hong Kong (S.A.R.) | 7 |
| Canada | 5 |
| Taiwan | 4 |
| Saudi Arabia | 2 |
| United Arab Emirates | 2 |
| New Zealand | 2 |
| India | 1 |
| Brazil | 1 |
| Philippines | 1 |
| Indonesia | 1 |
Where are Research Centres of Pudu Technology Patents Located?
10 Best Pudu Technology Patents
CN107662216A is the most popular patent in the Pudu Technology portfolio. It has received 37 citations so far from companies like Beijing Yunji Technology, Henan Jilida Robot and Hangzhou Haikang Robot Technology.
Below is the list of 10 most cited patents of Pudu Technology:
| Publication Number | Citation Count |
| CN107662216A | 37 |
| CN106842175A | 25 |
| CN303986810S | 19 |
| CN106851696A | 19 |
| CN106211080A | 15 |
| CN111275763A | 14 |
| CN107180285A | 14 |
| CN107609829A | 13 |
| CN106274334A | 13 |
| CN110632918A | 12 |
What Percentage of Pudu Technology US Patent Applications were Granted?
Pudu Technology (Excluding its subsidiaries) has filed 3 patent applications at USPTO so far (Excluding Design and PCT applications). Out of these 0 have been granted leading to a grant rate of 0.0%.
Below are the key stats of Pudu Technology patent prosecution at the USPTO.

Which Law Firms Filed Most US Patents for Pudu Technology?
| Law Firm | Total Applications | Success Rate |
| Dority & Manning | 3 | 0% |
What are Pudu Technology key innovation segments?
What Technologies are Covered by Pudu Technology?

The chart below distributes patents filed by Pudu Technology
