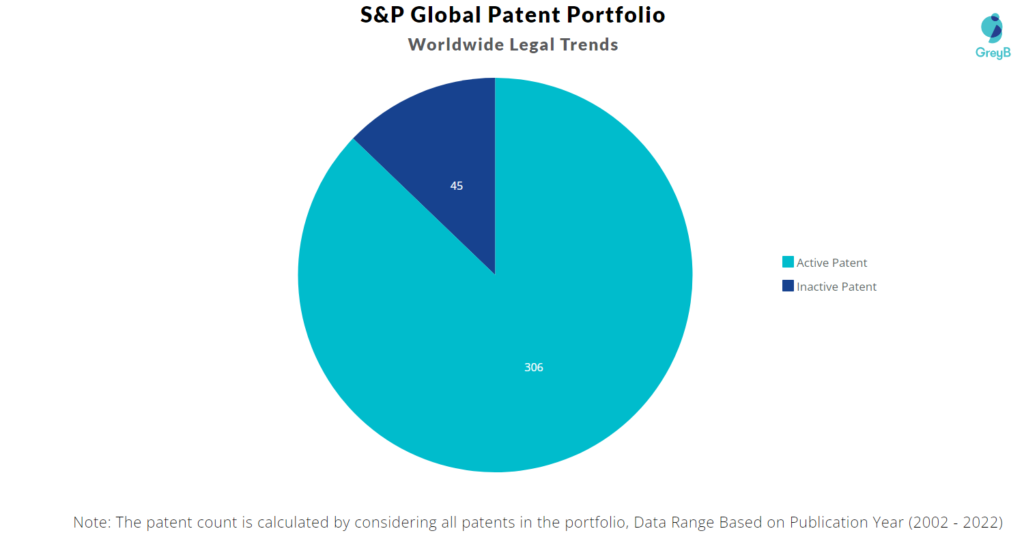
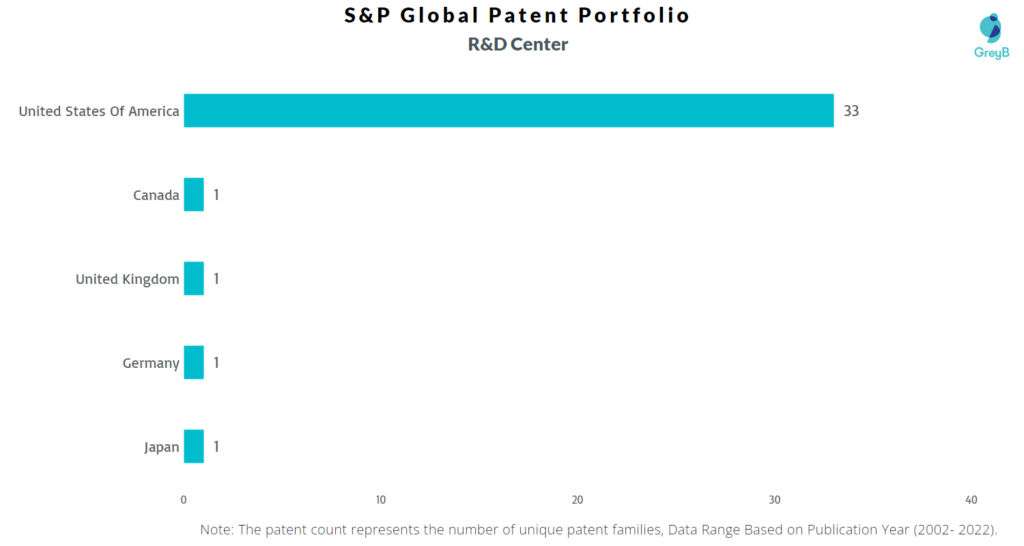
S&P Global has a total of 101 patents globally, out of which 41 have been granted. Of these 101 patents, more than 49% patents are active. United States of America is where S&P Global has filed the maximum number of patents, followed by Europe and Canada. Parallelly, USA seems to be the main focused R&D center and is also the origin country of S&P Global.
S&P Global was founded in 1917 by James H. McGraw. S&P Global provides clients with financial information services. The Company offers information regarding ratings, benchmarks, and analytics in the global capital and commodity markets. S&P Global operates worldwide. As of March 2022, S&P Global has a market cap of $149.35 Billion.
Do read about some of the most popular patents of S&P Global which have been covered by us in this article and also you can find S&P Global patents information, the worldwide patent filing activity and its patent filing trend over the years, and many other stats over S&P Global patent portfolio.
How many patents does the CEO of S&P Global have?
The CEO, Douglas L. Peterson have 0 patents.
How many patents does S&P Global have?
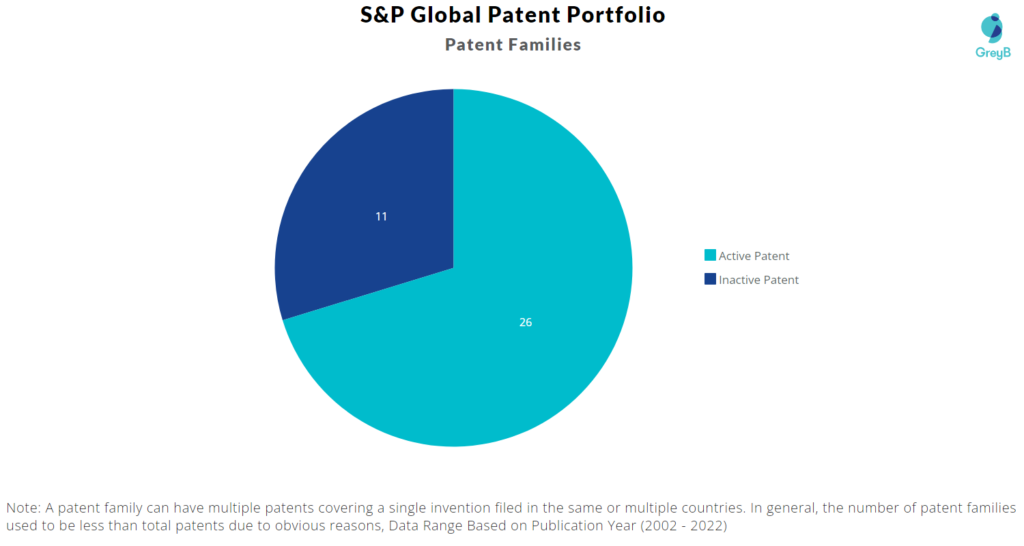
S&P Global has a total of 101 patents globally. These patents belong to 37 unique patent families. Out of 101 patents, 50 patents are active.
How Many Patents did S&P Global File Every Year?
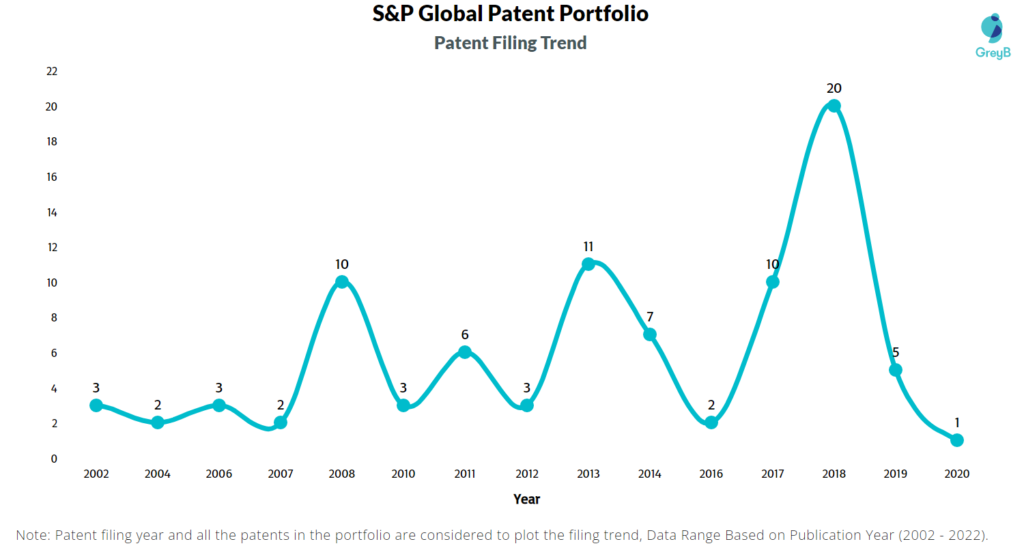
Are you wondering why there is a drop in patent filing for the last two years? It is because a patent application can take up to 18 months to get published. Certainly, it doesn’t suggest a decrease in the patent filing.
| Year of Patents Filing or Grant | S&P Global Applications Filed | S&P Global Patents Granted |
| 2011 | 6 | – |
| 2012 | 3 | 3 |
| 2013 | 11 | 3 |
| 2014 | 7 | 1 |
| 2015 | – | 1 |
| 2016 | 2 | 1 |
| 2017 | 10 | 2 |
| 2018 | 20 | 3 |
| 2019 | 5 | 5 |
| 2020 | 1 | 3 |
| 2021 | – | 9 |
| 2022 | – | 3 |
How many S&P Global patents are Alive/Dead?
Worldwide Patents
Patent Families
How Many Patents did S&P Global File in Different Countries?
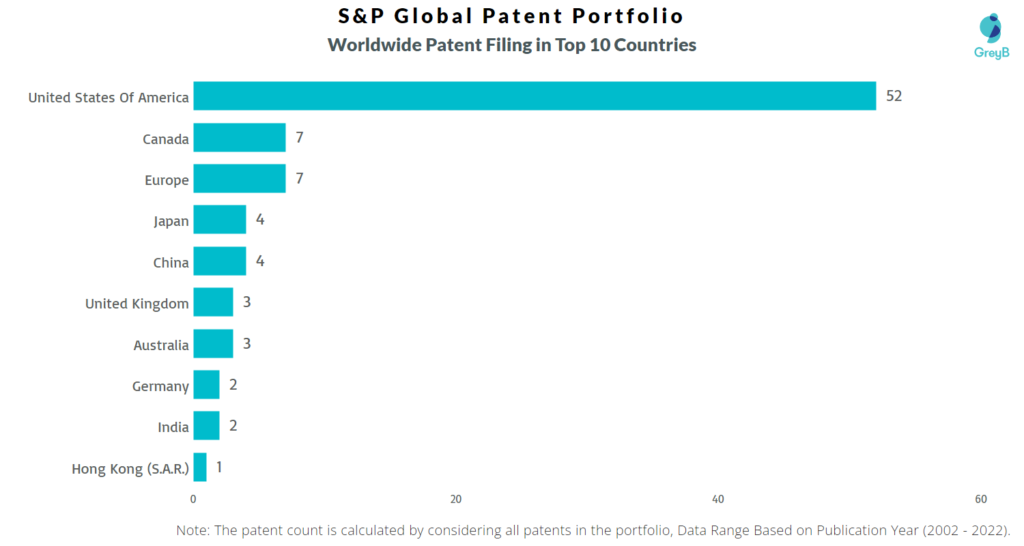
Countries in which S&P Global Filed Patents
| Country | Patents |
| United States Of America | 52 |
| Canada | 7 |
| Europe | 7 |
| Japan | 4 |
| China | 4 |
| United Kingdom | 3 |
| Australia | 3 |
| Germany | 2 |
| India | 2 |
| Hong Kong (S.A.R.) | 1 |
| Singapore | 1 |
| Korea (South) | 1 |
Where are Research Centers of S&P Global Patents Located?
10 Best S&P Global Patents
US20170091320A1 is the most popular patent in the S&P Global portfolio. It has received 234 citations so far from companies like Asm Ip Holdings, Wipro and Fujitsu Limited.
Below is the list of 10 most cited patents of S&P Global:
| Publication Number | Citation Count |
| US20170091320A1 | 234 |
| US20030172014A1 | 120 |
| US7039871B2 | 110 |
| US20140258032A1 | 104 |
| US20140344186A1 | 97 |
| US7093194B2 | 63 |
| US20020035530A1 | 59 |
| US8473354B2 | 52 |
| US8180713B1 | 39 |
| US8626618B2 | 36 |
What Percentage of S&P Global US Patent Applications were Granted?
S&P Global (Excluding its subsidiaries) has filed 21 patent applications at USPTO so far (Excluding Design and PCT applications). Out of these 6 have been granted leading to a grant rate of 100.0%.
Below are the key stats of S&P Global patent prosecution at the USPTO.

Which Law Firms Filed Most US Patents for S&P Global?
| Law Firm | Total Applications | Success Rate |
| Duke W Yee | 13 | 0% |
| Fish & Richardson Pc | 4 | 100.00% |
| Proskauer Rose Llp | 3 | 100.00% |
| Perkins Coie Llp | 1 | 0% |
EXCLUSIVE INSIGHTS COMING SOON!
What are S&P Global‘s key innovation segments?
