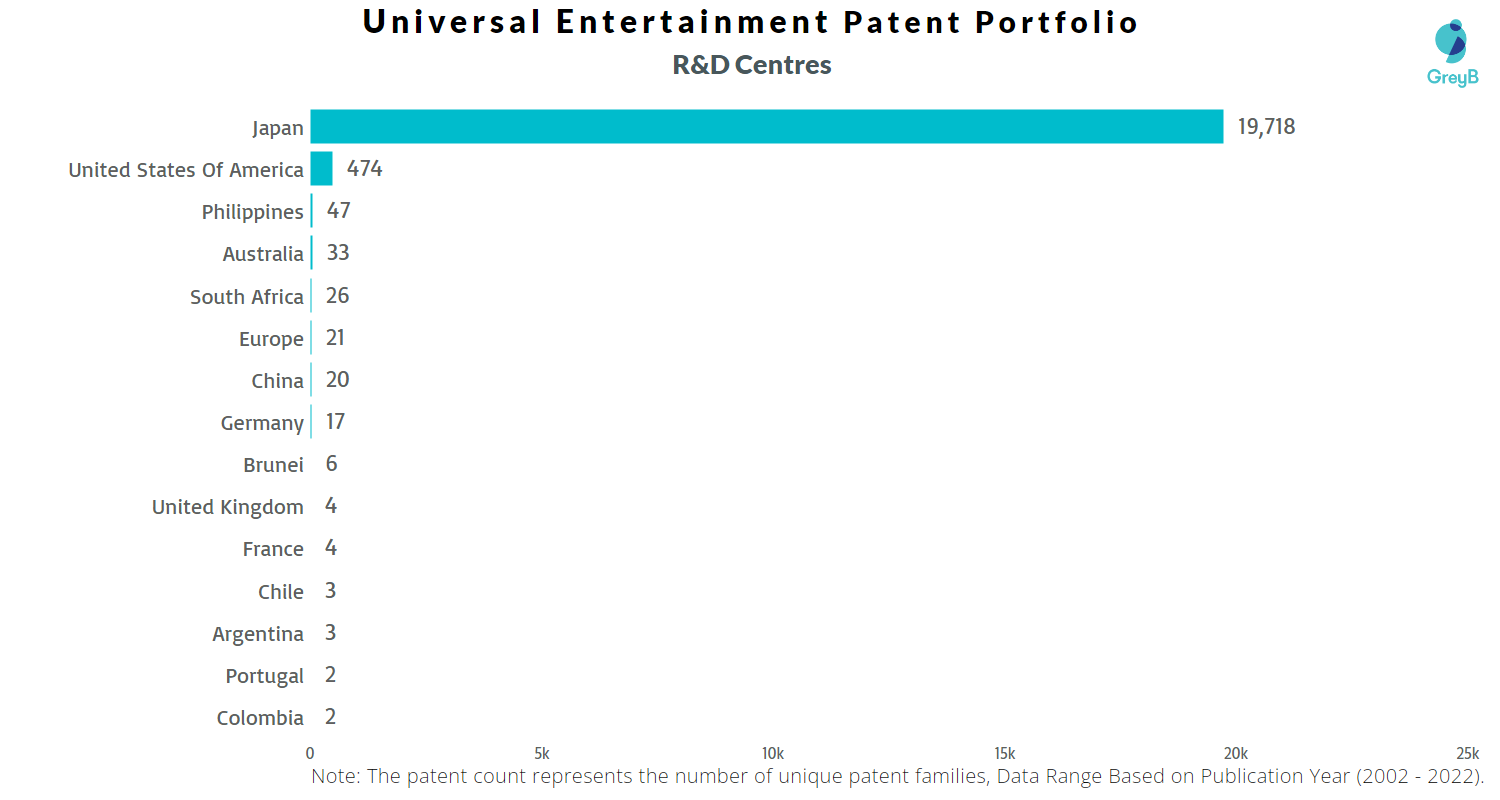
Universal Entertainment has a total of 27033 patents globally, out of which 8918 have been granted. Of these 27033 patents, more than 31% patents are active. Japan is where Universal Entertainment has filed the maximum number of patents, followed by the USA and Australia. Parallelly, Japan seems to be the main focused R&D center and also is the origin country of Universal Entertainment.
Universal Entertainment was founded in 1969. Universal Entertainment develops, manufactures, and sells pachinko, pachinko slot machines, amusement equipments & casino equipments designed for overseas use. As of October 2022, Universal Entertainment has a market cap of $1.03 Billion.
Do read about some of the most popular patents of Universal Entertainment which have been covered by us in this article and also you can find Universal Entertainment patents information, the worldwide patent filing activity and its patent filing trend over the years, and many other stats over Universal Entertainment’s patent portfolio.
How many patents does Universal Entertainment have?
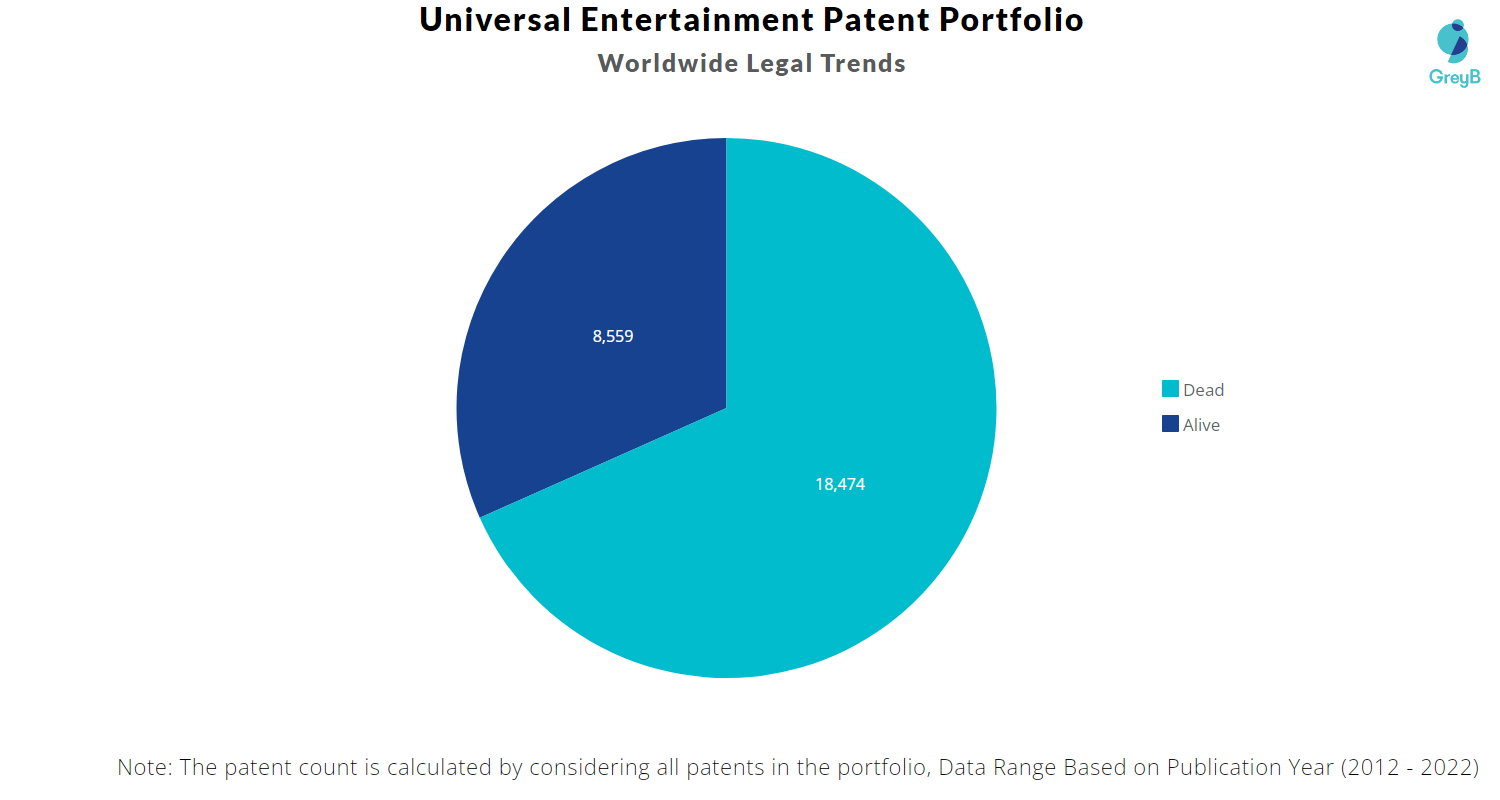
Universal Entertainment has a total of 27033 patents globally. These patents belong to 20391 unique patent families. Out of 27033 patents, 8559 patents are active.
How Many Patents did Universal Entertainment File Every Yea
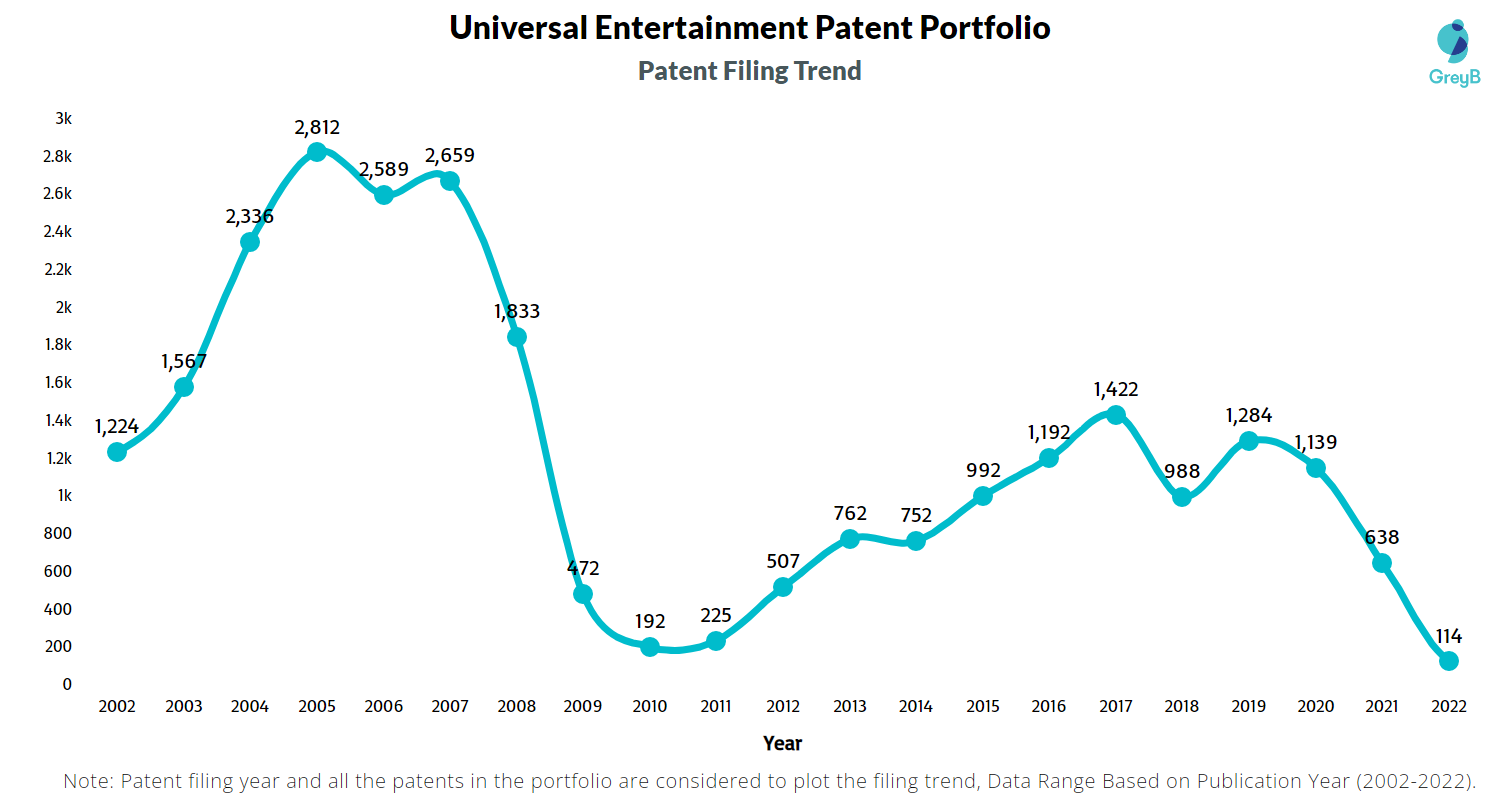
Are you wondering why there is a drop in patent filing for the last two years? It is because a patent application can take up to 18 months to get published. Certainly, it doesn’t suggest a decrease in the patent filing.
| Year of Patents Filing or Grant | Universal Entertainment Applications Filed | Universal Entertainment Patents Granted |
| 2011 | 225 | 360 |
| 2012 | 507 | 450 |
| 2013 | 762 | 508 |
| 2014 | 752 | 540 |
| 2015 | 992 | 500 |
| 2016 | 1192 | 655 |
| 2017 | 1422 | 684 |
| 2018 | 988 | 613 |
| 2019 | 1284 | 683 |
| 2020 | 1139 | 36 |
| 2021 | 638 | 241 |
| 2022 | 114 | 679 |
How many Universal Entertainment patents are Alive/Dead?
Worldwide Patents
How Many Patents did Universal Entertainment File in Different Countries?

Countries in which Universal Entertainment Filed Patents
| Country | Patents |
| Japan | 20745 |
| United States Of America | 1811 |
| Australia | 1047 |
| Macao | 665 |
| South Africa | 662 |
| China | 545 |
| Europe | 446 |
| Philippines | 171 |
| Eurasia | 145 |
| Korea (South) | 142 |
| Germany | 114 |
| Austria | 92 |
| Singapore | 66 |
| Malaysia | 61 |
| Taiwan | 60 |
| Spain | 32 |
| Argentina | 15 |
| Colombia | 11 |
| Peru | 11 |
| Portugal | 11 |
| Brazil | 7 |
| Viet Nam | 6 |
| Brunei | 6 |
| Russia | 5 |
| Slovenia | 5 |
| France | 4 |
| Chile | 3 |
| Uruguay | 3 |
| United Kingdom | 3 |
| Canada | 2 |
| Hong Kong (S.A.R.) | 1 |
| Bolivia | 1 |
Where are Research Centers of Universal Entertainment Patents Located?
10 Best Universal Entertainment Patents
US20090247272A1 is the most popular patent in the Universal Entertainment portfolio. It has received 395 citations so far from companies like Gamblit Gaming Llc, Konami Gaming, Inc and Ainsworth Game Technology Limited.
Below is the list of 10 most cited patents of Universal Entertainment:
| Publication Number | Citation Count |
| US20090247272A1 | 395 |
| US8167699B2 | 321 |
| US6857958B2 | 298 |
| US20040214637A1 | 210 |
| US6695697B1 | 205 |
| US20030069073A1 | 186 |
| US6790142B2 | 175 |
| US6937298B2 | 167 |
| US20040150162A1 | 164 |
| US20040116178A1 | 161 |
Which Companies are using Universal Entertainment Patents to Advance their Research?
If patents or patents from a particular technology area of a company receive a lot of citations, it implies that the technology is being followed and incrementally innovated by the citing companies. It also indicates that citing companies are working on similar and closely related technologies.
The top citing companies in the Universal Entertainment patent portfolio are Sg Gaming Inc, IGT, and UBS.
List of the top forward citing Companies –
| Company | Number of Patents |
| Sg Gaming Inc | 61 |
| IGT | 57 |
| Ubs Ag | 35 |
| Konami Gaming Inc | 25 |
| Aristocrat Technologies Australia Pty Limited | 14 |
| Jefferies Finance Llc | 13 |
| Angel Playing Cards Co Ltd | 12 |
| Konami Digital Entertainment | 12 |
| IBM | 9 |
| Novomatic | 8 |
Count of 102 and 103 Type Rejections based on Universal Entertainment Patents
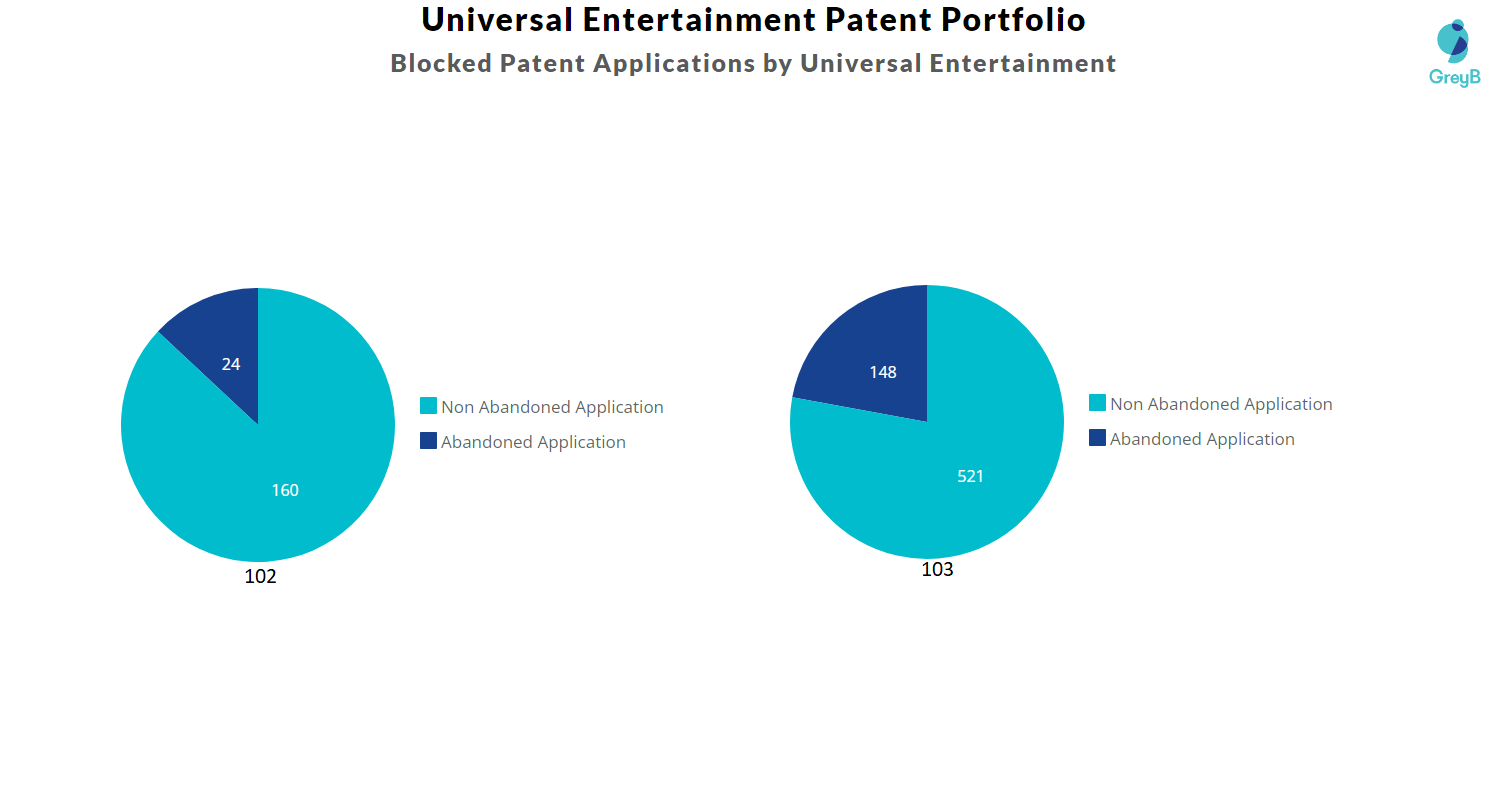
Top Universal Entertainment Patents used in Rejecting Most Patent Applications
| Patent Number | Count of Rejected Applications |
| US7676369B2 | 10 |
| US7868242B2 | 9 |
| US9378605B2 | 8 |
| US20070281775A1 | 7 |
| US6857958B2 | 7 |
| US20060025222A1 | 7 |
| US9105141B2 | 6 |
| US20100147351A1 | 6 |
| US20060183544A1 | 6 |
| US20070016936A1 | 6 |
| US20070092118A1 | 6 |
| US20060003843A1 | 5 |
| US20050089172A1 | 5 |
| US7086946B2 | 5 |
| US20040214637A1 | 5 |
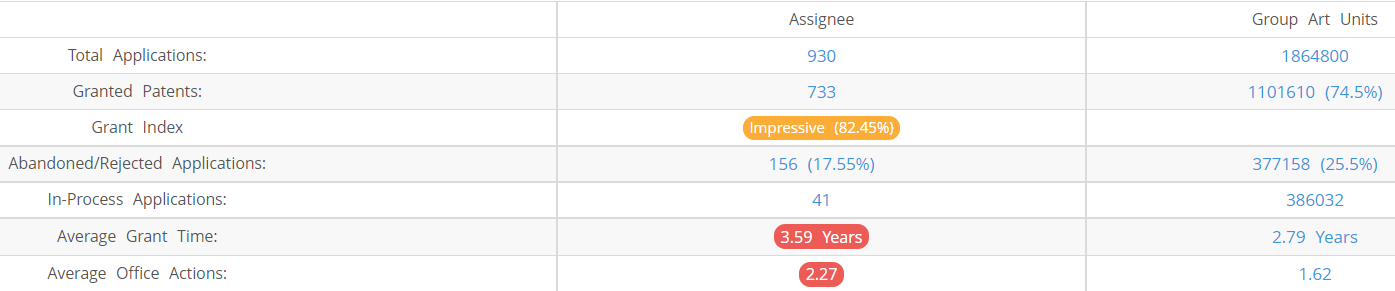
What Percentage of Universal Entertainment US Patent Applications were Granted?
Universal Entertainment (Excluding its subsidiaries) has filed 930 patent applications at USPTO so far (Excluding Design and PCT applications). Out of these 733 have been granted leading to a grant rate of 82.4%.
Below are the key stats of Universal Entertainment patent prosecution at the USPTO.
Which Law Firms Filed Most US Patents for Universal Entertainment?
| Law Firm | Total Applications | Success Rate |
| Lex Ip Meister Pllc | 317 | 75.08% |
| United Ip Counselors Llc Uec | 177 | 82.74% |
| Simpson & Simpson Pllc | 68 | 80.00% |
| Oblon Mcclelland Maier & Neustadt Llp | 67 | 85.07% |
| Polsinelli Pc Watchstone Llp | 44 | 88.64% |
| Locke Lord Llp | 40 | 82.50% |
| Leydig Voit & Mayer Ltd | 31 | 93.55% |
| Arentfox Schiff Llp | 30 | 96.67% |
| Fishman Stewart Pllc | 29 | 96.55% |
| Sheppard Mullin Richter & Hampton Llp | 28 | 82.14% |