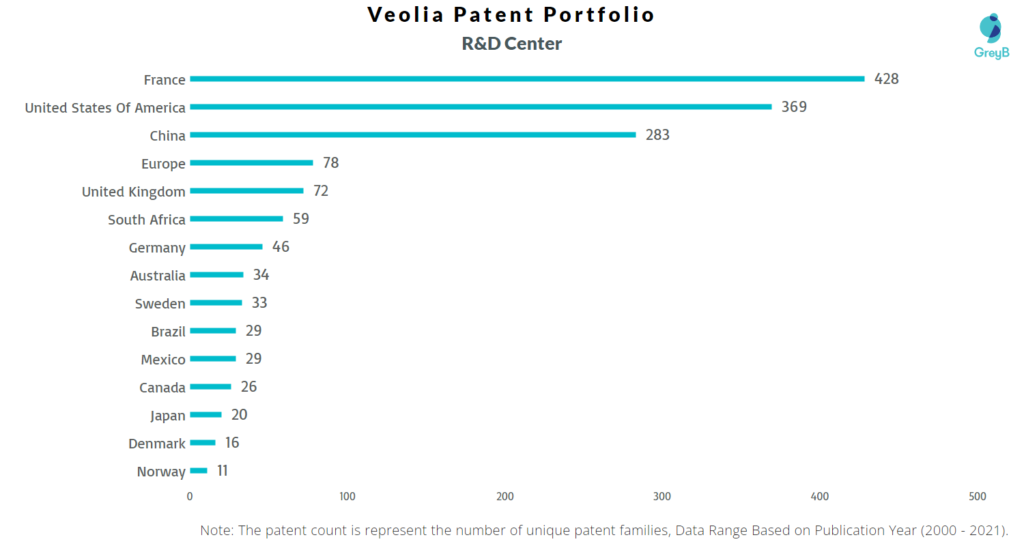
Veolia has a total of 5730 patents globally, out of which 3004 have been granted. Of these 5730 patents, more than 54% patents are active. The United States of America is where Veolia has filed the maximum number of patents, followed by China and Europe and it also seems reasonable as the biggest market for Veolia is USA & Europe. Parallelly, France and USA seems to be the main focused R&D center and France is the origin country of Veolia.
Veolia was founded in 1853, Veolia is the global leader in optimized resource management. The Group designs and provides water, waste and energy management solutions. Veolia helps to develop access to resources, preserve available resources, and replenish them. It also contributes to the sustainable development of communities and industries. As of January 2022, Veolia has a market cap of $25.47 Billion.
Do read about some of the most popular patents of Veolia which have been covered by us in this article and also you can find Veolia patents information, the worldwide patent filing activity and its patent filing trend over the years, and many other stats over the Veolia patent portfolio.
How many patents does the CEO of Veolia have?
The CEO, Antoine Frérot have 0 patents.
How many patents does Veolia have?
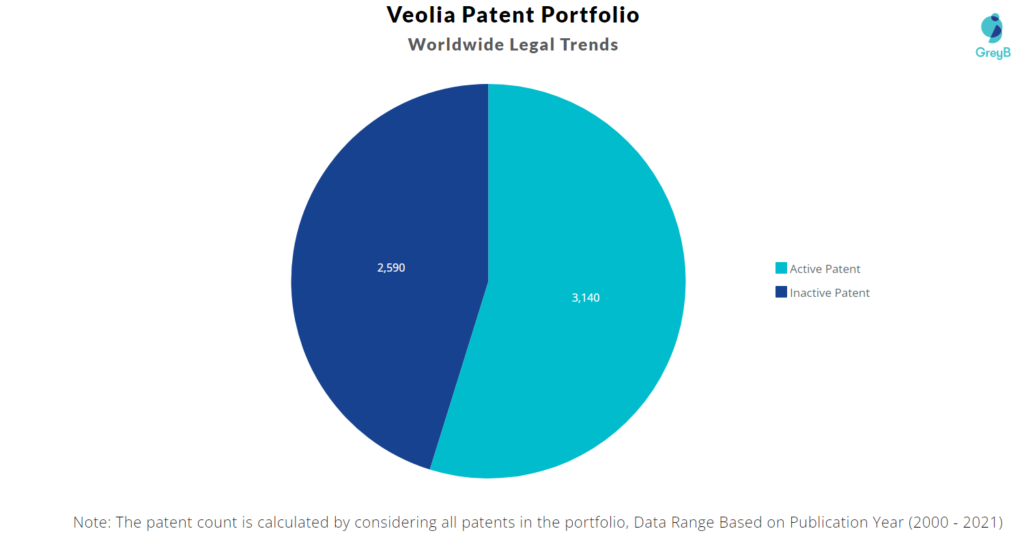
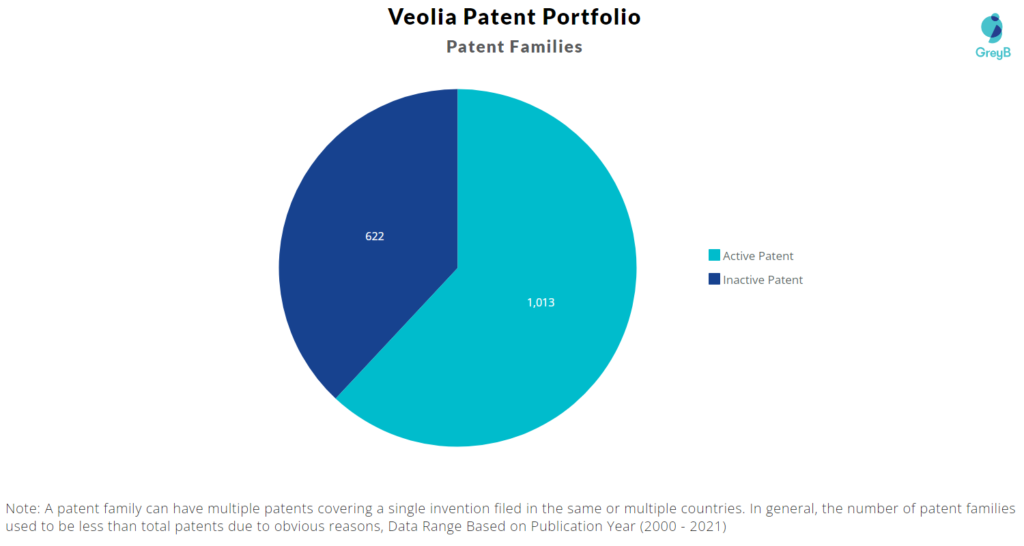
Veolia has a total of 5730 patents globally. These patents belong to 1635 unique patent families. Out of 5730 patents, 3140 patents are active.
How many Veolia patents are Alive/Dead?
Worldwide Patents
Patent Families
How Many Patents did Veolia File Every Year?
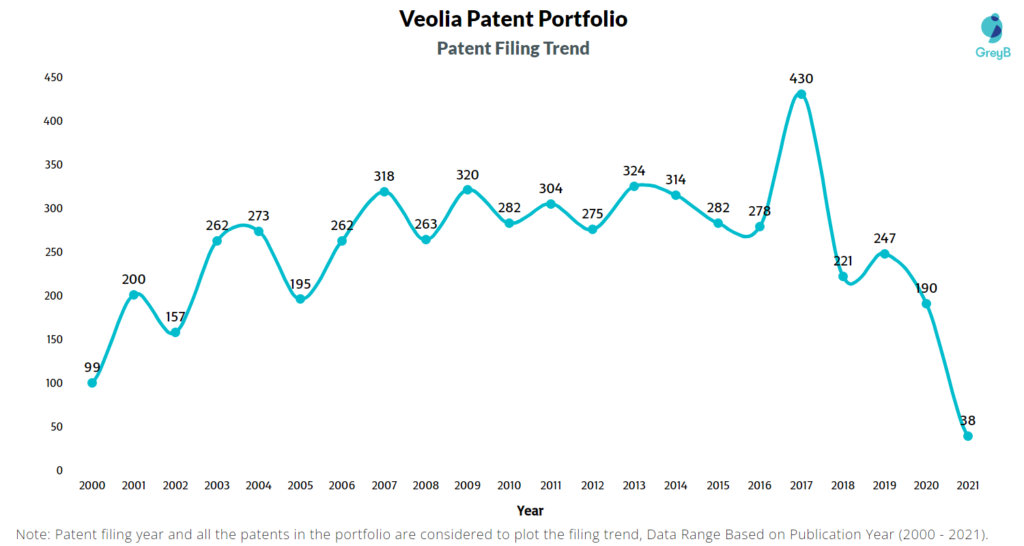
Are you wondering why there is a drop in patent filing for the last two years? It is because a patent application can take up to 18 months to get published. Certainly, it doesn’t suggest a decrease in the patent filing.
| Year of Patents Filing or Grant | Veolia Applications Filed | Veolia Patents Granted |
| 2011 | 304 | 152 |
| 2012 | 275 | 176 |
| 2013 | 324 | 146 |
| 2014 | 314 | 191 |
| 2015 | 282 | 181 |
| 2016 | 278 | 179 |
| 2017 | 430 | 165 |
| 2018 | 221 | 207 |
| 2019 | 247 | 216 |
| 2020 | 190 | 281 |
| 2021 | 38 | 269 |
How Many Patents did Veolia File in Different Countries?
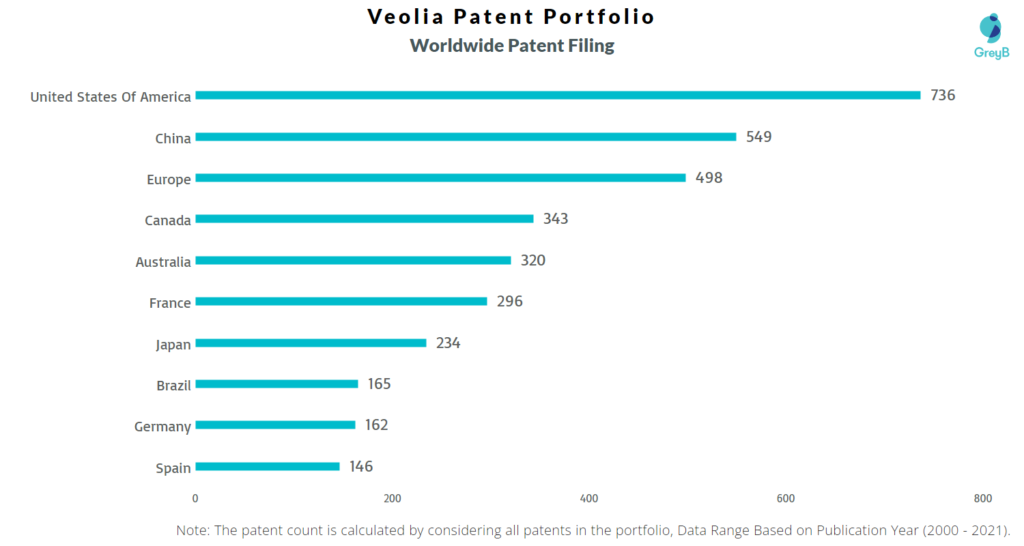
Countries in which Veolia Filed Patents
| Country | Patents |
| United States Of America | 736 |
| China | 549 |
| Europe | 498 |
| Canada | 343 |
| Australia | 320 |
| France | 296 |
| Japan | 234 |
| Brazil | 165 |
| Germany | 162 |
| Spain | 146 |
| South Africa | 133 |
| Korea (South) | 132 |
| Denmark | 111 |
| Mexico | 104 |
| Singapore | 85 |
| United Kingdom | 79 |
| Poland | 76 |
| Russian Federation | 75 |
| India | 73 |
| Austria | 70 |
| Hong Kong (S.A.R.) | 57 |
| Israel | 50 |
| Portugal | 49 |
| Norway | 45 |
| Malaysia | 38 |
| Turkey | 36 |
| Argentina | 36 |
| Chile | 35 |
| Indonesia | 32 |
| Philippines | 29 |
| Morocco | 27 |
| New Zealand | 25 |
| Gulf Cooperation Council | 23 |
| Tunisia | 21 |
| Sweden | 17 |
| Peru | 16 |
| Eurasian Patent Organization | 15 |
| Colombia | 14 |
| Taiwan | 13 |
| Hungary | 13 |
| Slovenia | 12 |
| Viet Nam | 11 |
| Ukraine | 10 |
| Croatia | 10 |
| African Intellectual Property Organization | 7 |
| African Regional Industrial Property Organization | 7 |
| Italy | 6 |
| Czech Republic | 5 |
| Lithuania | 5 |
| Ecuador | 5 |
| Estonia | 5 |
| Finland | 4 |
| Serbia | 4 |
| Thailand | 4 |
| Netherlands | 3 |
| Belgium | 3 |
| Georgia | 2 |
| Uruguay | 2 |
| Saudi Arabia | 2 |
| Costa Rica | 2 |
| Cyprus | 2 |
| Egypt | 2 |
| Iceland | 1 |
| Bulgaria | 1 |
| Latvia | 1 |
| Guatemala | 1 |
| Jordan | 1 |
| Panama | 1 |
| Dominican Republic | 1 |
| Luxembourg | 1 |
| Slovakia | 1 |
| El Salvador | 1 |
Where are Research Centers of Veolia Patents Located?
10 Best Veolia Patents
US7172701B2 is the most popular patent in the Veolia portfolio. It has received 118 citations so far from companies like USFilter Corp, Siemens Water Technologies and Evoqua Water Technologies.
Below is the list of 10 most cited patents of Veolia:
| Publication Number | Citation Count |
| US7172701B2 | 118 |
| US20100119370A1 | 114 |
| US7147778B1 | 106 |
| US7815804B2 | 71 |
| WO2010012691A1 | 62 |
| WO2004076026A1 | 62 |
| US7189323B2 | 52 |
| WO2007135087A1 | 51 |
| WO2008071516A1 | 50 |
| US7001525B2 | 49 |
Which Companies are using Veolia Patents to Advance their Research?
If patents or patents from a particular technology area of a company receive a lot of citations, it implies that the technology is being followed and incrementally innovated by the citing companies. It also indicates that citing companies are working on similar and closely related technologies.
The top citing companies in the Veolia patent portfolio are IBM, Oracle and Siemens.
List of the top forward citing Companies –
| Company | Number of Patents |
| IBM | 24 |
| Oracle | 16 |
| Siemens | 12 |
| Evoqua Water Technologies | 11 |
| General Electric | 11 |
| Microsoft | 10 |
| 9 | |
| Canon | 9 |
| Walmart Apollo Llc | 8 |
| Sap Se | 7 |
Count of 102 and 103 Type Rejections based on Veolia Patents
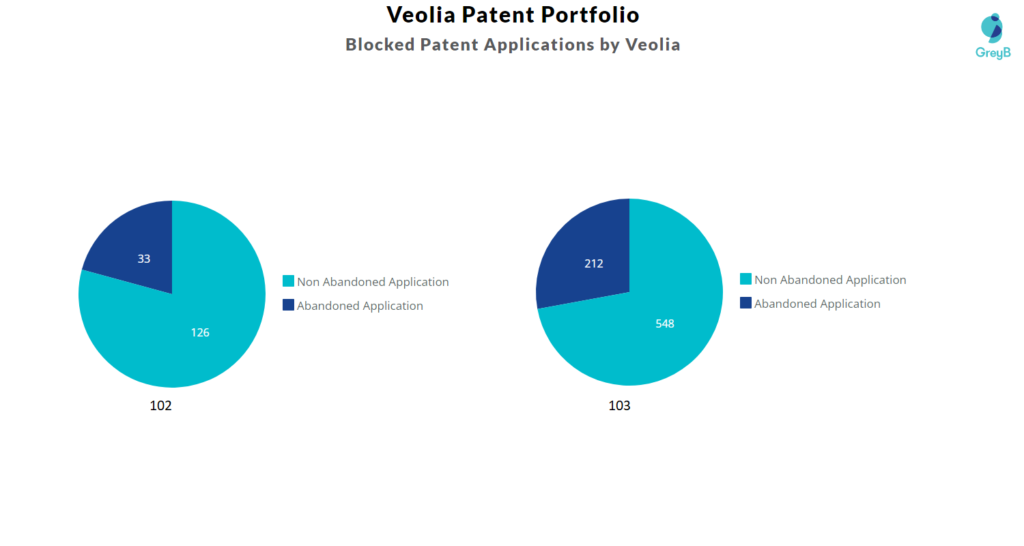
Top Veolia Patents used in Rejecting Most Patent Applications
| Patent Number | Count of Rejected Applications |
| US10621203B2 | 91 |
| US20080288889A1 | 33 |
| US20080294996A1 | 27 |
| US10325272B2 | 26 |
| US20080270363A1 | 25 |
| US20090006156A1 | 21 |
| US20100119370A1 | 12 |
| US20050194323A1 | 11 |
| US7815804B2 | 11 |
| US7447869B2 | 10 |
| US20020035327A1 | 9 |
| US8670750B2 | 9 |
| US8047287B2 | 8 |
| US6918215B2 | 8 |
| US7353709B2 | 8 |
What Percentage of Veolia US Patent Applications were Granted?
Veolia (Excluding its subsidiaries) has filed 365 patent applications at USPTO so far (Excluding Design and PCT applications). Out of these 268 have been granted leading to a grant rate of 78.36%.
Below are the key stats of Veolia patent prosecution at the USPTO.

Which Law Firms Filed Most US Patents for Veolia?
| Law Firm | Total Applications | Success Rate |
| Coats & Bennett | 213 | 72.73% |
| Clean Harbors Environmental Services Inc | 17 | 87.50% |
| Holland & Hart Llp | 11 | 85.71% |
| Faegre Drinker Biddle & Reath | 10 | 80.00% |
| Schwabe Williamson & Wyatt | 10 | 100.00% |
| Michael Best & Friedrich | 7 | 85.71% |
| Morrison & Foerster | 5 | 75.00% |
| Merchant & Gould | 4 | 100.00% |
| Honigman Llp | 3 | 100.00% |
| Peter C Lando | 3 | 100.00% |
“In Veolia’s eyes, ecological innovation is local, collaboratively developed, data-driven, high-tech and cost-effective.”
Climate change, resource depletion, biodiversity loss, multiple pollution sources… these pressing concerns have pushed Veolia’s ecological transformation challenge to the top of its priority list. We know that half of the ecological solutions are already in place, while the other half must be developed. The road to tackling these difficulties and allowing everyone to achieve their biological, human, and social requirements with the goal of enhancing living standards and ensuring the sustainability of our world is to drive ecological innovation with and for all of our stakeholders.
Veolia is a big believer in developing collaborations in order to address the unique needs of our clients and to develop technological advancements. The key to promoting and speeding the development of these solutions is to take an integrated strategy to data use.
Veolia’s approach to ecological innovation takes into account a variety of factors, including scientific, technological, commercial, social, and corporate characteristics, in order to develop the new services and markets needed to advance the ecological transformation agenda.
EXCLUSIVE INSIGHTS COMING SOON!
What are Veolia’s key innovation segments?
What Technologies are Covered by Veolia?
The chart below distributes patents filed by Veolia in different countries on the basis of the technology protected in patents. It also represents the markets where Veolia thinks it’s important to protect particular technology inventions.

R&D Focus: How Veolia search focus changed over the years?
EXCLUSIVE INSIGHTS COMING SOON!
Interested in knowing about the areas of innovation that are being protected by Veolia?
