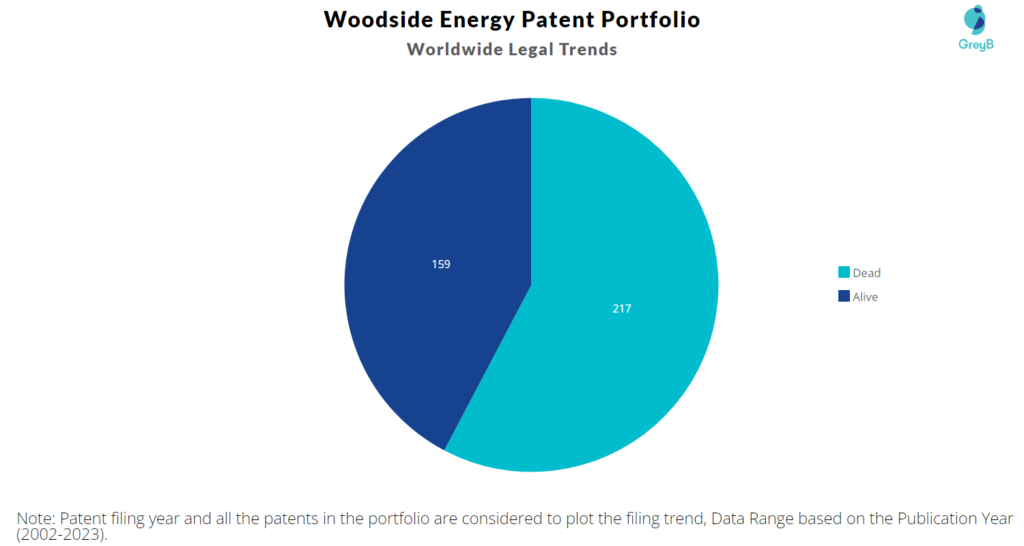
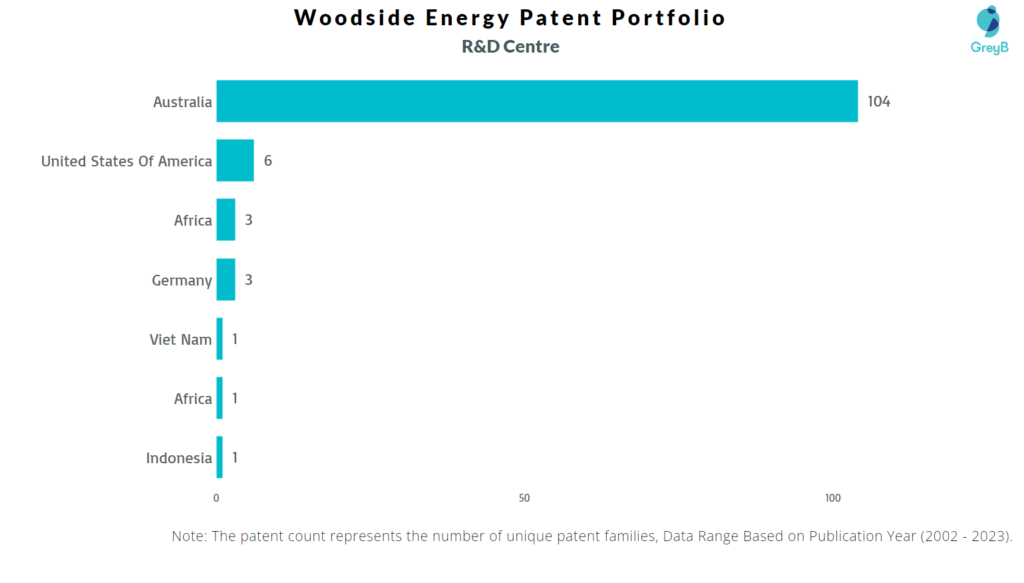
Woodside Energy has a total of 376 patents globally, out of which 119 have been granted. Of these 376 patents, more than 42% patents are active. Australia is where Woodside Energy has filed the maximum number of patents, followed by the United States of America and Europe. Parallelly, Australia seems to be the main focused R&D centre and also is the origin country of Woodside Energy.
Woodside Energy was founded in the year 1954. Oil exploration and production are the main businesses of Woodside Energy. The firm sells crude oil, natural gas, and other petroleum-based goods. As of April 2023, Woodside Energy has a market cap of $44.67 Billion.
Do read about some of the most popular patents of Woodside Energy which have been covered by us in this article and also you can find Woodside Energy patents information, the worldwide patent filing activity and its patent filing trend over the years, and many other stats over Woodside Energy patent portfolio.
How many patents does the founder and the CEO of Woodside Energy have?
The founder Geoff Donaldson have 4 patents and CEO Meg O’Neill have 0 patents.
How many patents does Woodside Energy have?
Woodside Energy has a total of 376 patents globally. These patents belong to 119 unique patent families. Out of 376 patents, 159 patents are active.
How Many Patents did Woodside Energy File Every Year?
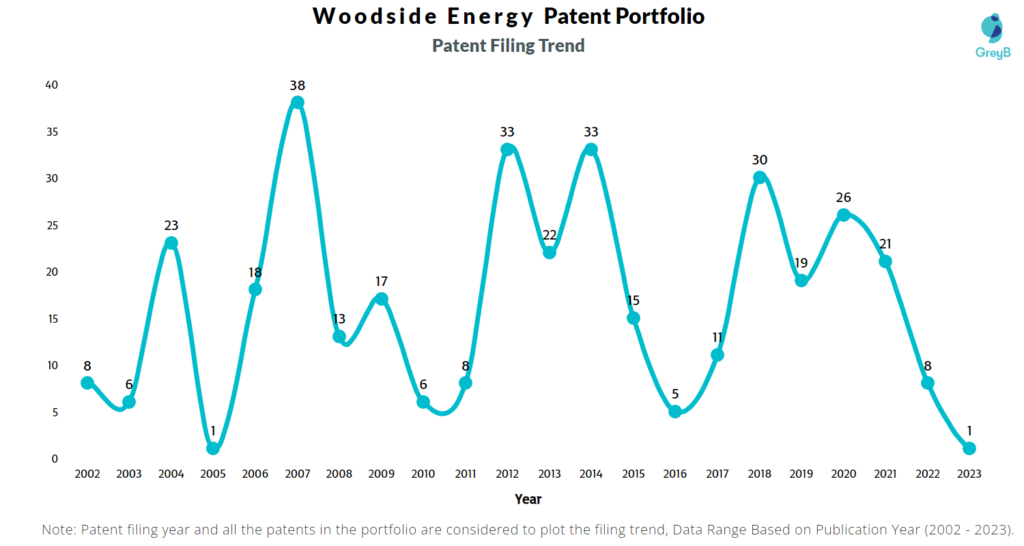
Are you wondering why there is a drop in patent filing for the last two years? It is because a patent application can take up to 18 months to get published. Certainly, it doesn’t suggest a decrease in the patent filing.
| Year of Patents Filing or Grant | Woodside Energy Applications Filed | Woodside Energy Patents Granted |
| 2023 | 1 | – |
| 2022 | 8 | 15 |
| 2021 | 21 | 2 |
| 2020 | 26 | 10 |
| 2019 | 19 | 5 |
| 2018 | 30 | 12 |
| 2017 | 11 | 8 |
| 2016 | 5 | 7 |
| 2015 | 15 | 7 |
| 2014 | 33 | 10 |
| 2013 | 22 | 11 |
| 2012 | 33 | 4 |
| 2011 | 8 | 5 |
How many Woodside Energy patents are Alive/Dead?
How Many Patents did Woodside Energy File in Different Countries?
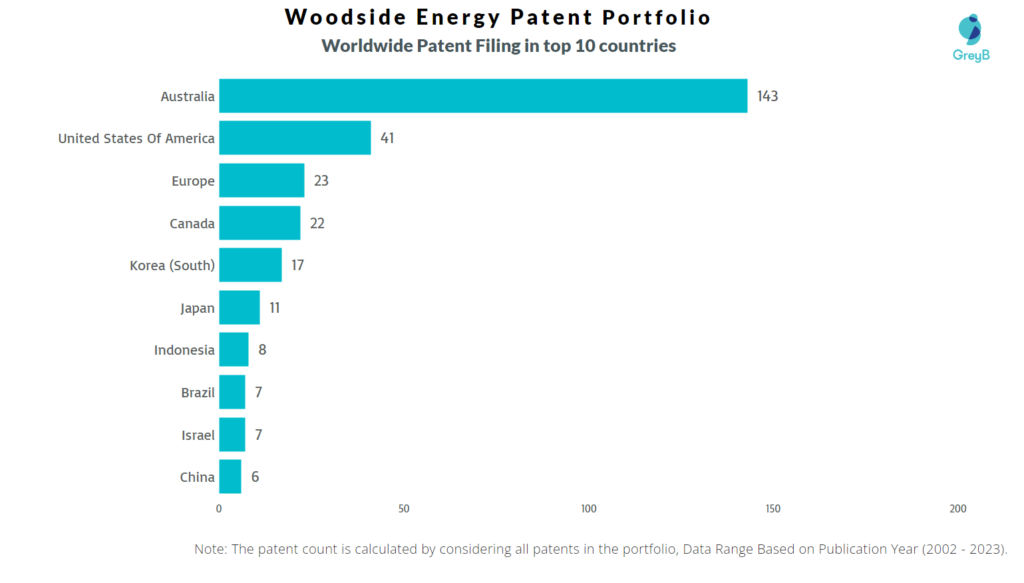
Countries in which Woodside Energy Filed Patents
| Country | Patent |
| Australia | 143 |
| United States Of America | 41 |
| Europe | 23 |
| Canada | 22 |
| Korea (South) | 17 |
| Japan | 11 |
| Indonesia | 8 |
| Brazil | 7 |
| Israel | 7 |
| China | 6 |
| Germany | 6 |
| India | 6 |
| Africa | 6 |
| Malaysia | 3 |
| Austria | 3 |
| Norway | 3 |
| Singapore | 2 |
| Viet Nam | 2 |
| Gulf Cooperation Council | 2 |
| Hong Kong (S.A.R.) | 2 |
| Mexico | 2 |
| Egypt | 1 |
| South Africa | 1 |
| Eurasia | 1 |
| Russia | 1 |
| Taiwan | 1 |
Where are Research Centres of Woodside Energy Patents Located?
10 Best Woodside Energy Patents
US6855852B1 is the most popular patent in the Woodside Energy portfolio. It has received 118 citations so far from companies like Greatpoint Energy, Osegovic and Stx Offshore & Shipbuilding.
Below is the list of 10 most cited patents of Woodside Energy:
| Publication Number | Citation Count |
| US6855852B1 | 118 |
| US20070214804A1 | 32 |
| US7380609B2 | 32 |
| US20100024472A1 | 30 |
| WO2011057324A1 | 30 |
| WO2010135772A1 | 29 |
| WO2014028961A1 | 23 |
| JP2016514823A | 23 |
| US20090126372A1 | 19 |
| US20110030391A1 | 16 |
How many inventions of other companies were rejected due to Woodside Energy patents?
The statistics below share strategic R&D insights. It tells the companies that were trying to protect inventions similar to Woodside Energy invention. They couldn’t because Woodside Energy had protected those before them.
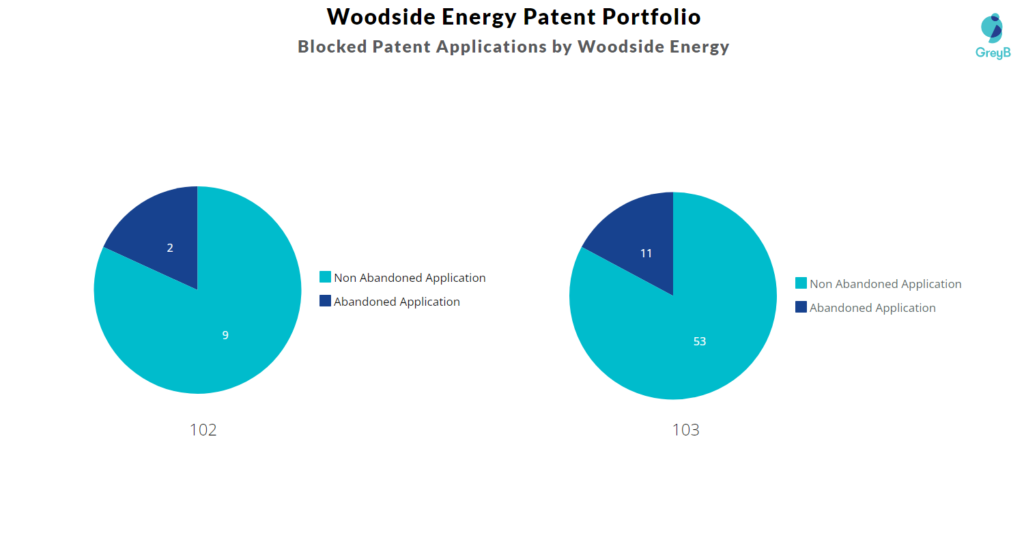
Examiners at the USPTO referred 24 Woodside Energy patents in 141 rejections (35 USC § 102 or 35 USC § 103 types).
The top citing companies in the Woodside Energy patent portfolio are Baker Hughes, Jgc Corporation and General Electric.
List of the Companies whose Patents were rejected citing Woodside Energy –
| Company | Number of Patent Applications that faced Rejection Citing Woodside Energy Patents | Number of Rejections (102 & 103) |
| Baker Hughes | 4 | 9 |
| Jgc Corporation | 4 | 7 |
| General Electric | 3 | 6 |
| Daewoo Shipbuilding & Marine Engineering | 2 | 4 |
| Air Products And Chemicals | 2 | 3 |
| Chevron Usa | 2 | 4 |
| Fluor Technologies | 2 | 8 |
| Chiyoda Corporation | 2 | 2 |
| Schlumberger | 2 | 6 |
| Cryostar | 2 | 8 |
Count of 102 and 103 Type Rejections based on Woodside Energy Patents
Top Woodside Energy Patents used in Rejecting Most Patent Applications
| Patent Number | Count of Rejected Applications |
| US7380609B2 | 12 |
| US7976613B2 | 6 |
| US9746234B2 | 5 |
| US10539361B2 | 4 |
| US8069677B2 | 4 |
| US7438135B2 | 4 |
| US10060670B2 | 3 |
| US8607580B2 | 3 |
| US20160231050A1 | 3 |
| US20160202378A1 | 3 |
| US20090193780A1 | 2 |
| US20070214804A1 | 2 |
| US8547784B2 | 2 |
| US20140345299A1 | 2 |
| US20090126372A1 | 2 |
