India for the first time made it to the top 40 countries at the Global Innovation Index (GII), led by improvement in information and communication technologies (ICT) services exports, venture capital recipients’ value, and finance for startups. India has moved up the Global Innovation Index rankings from 81 in 2015–16 to 40 in 2023.
This is pretty impressive as the GII, released by World Intellectual Property Organization (WIPO), reveals the most innovative economies in the world, ranking the innovation performance of 132 economies.
To better understand what has been happening in India, we have attempted to delve deeper into the data of the patents filed in the last seven years (2018–Jan 2025).
Exploring the Patent filing Trend in India, in the last 7 years
How Many Patents were published & granted in India Every Year?
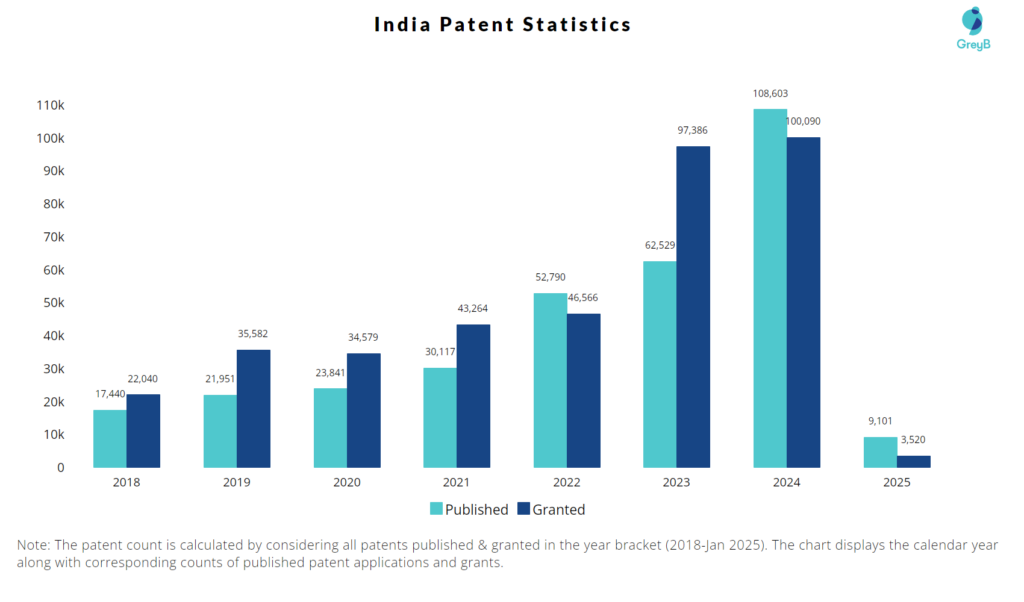
Also, are you wondering why there is a drop in patent filing for the last two years? It is because a patent application can take up to 18 months to get published. Certainly, it doesn’t suggest a decrease in patent filing. We are considering total records of published patent applications for our research, utilising the most recent year’s patent count for comparison.
| Year | Published Patent Applications | Granted Patent Count |
| 2025 | 9101 | 3520 |
| 2024 | 108603 | 100090 |
| 2023 | 62529 | 97386 |
| 2022 | 52790 | 46566 |
| 2021 | 30117 | 43264 |
| 2020 | 23841 | 34579 |
| 2019 | 21951 | 35582 |
| 2018 | 17440 | 22040 |
In comparison to the approx. 3.2 lakh published patent applications filed during the time period 2018-Jan 2025, there were around 3.8 lakh patent applications that were granted during the same time period.
For the period 2018 – Jan2025, on an average 40800 patents were filed every year. It was the highest for the year 2024. The number of patents granted during the same time period was around 48000. It was the highest in the year 2024.
Where did the majority of India’s innovations come from?
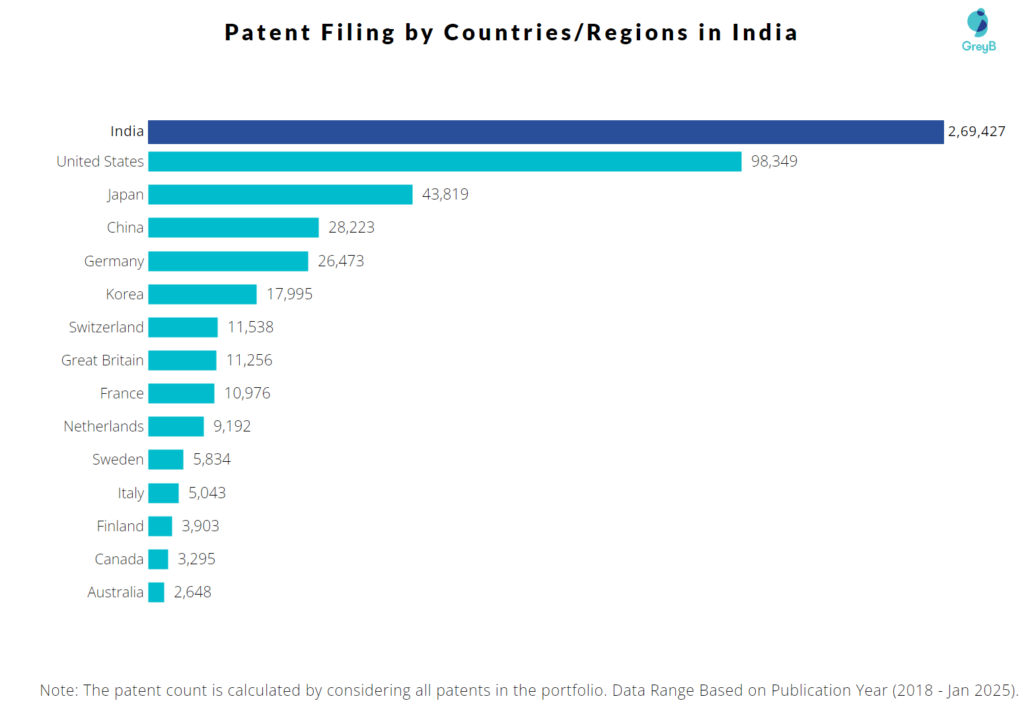
This graph is an indicator of the main R&D locations, as most players file patents locally. It displays the geographical coverage of patent families filed in India. It also reveals which countries want their inventions protected in India.
The major contributions in patent filing, outside India, has come from the USA & Japan.
Want to know the Most Innovative Companies in India for the year 2023? Click here
Key Companies
Top Patent Filers
| Assignee | Patent Count |
| Qualcomm | 18239 |
| Samsung Electronics | 11201 |
| Huawei | 8488 |
| Ericsson | 5901 |
| Sabyasachi | 4685 |
| Philips | 4476 |
| Microsoft | 4341 |
| Bosch | 4181 |
| Honda Motor | 3837 |
| Oppo | 3167 |
| 3142 | |
| Xiaomi | 2987 |
| Apple | 2978 |
| LG Electronics | 2835 |
| BASF | 2649 |
| TCS | 2644 |
| TVS Motor | 2617 |
| Nokia | 2481 |
| JFE Steel | 2463 |
| Mitsubishi Electric | 2457 |
| Suzuki Motor | 2403 |
| Nippon Steel | 2092 |
| Signify | 2064 |
| BHEL | 2052 |
| Mahindra & Mahindra | 1931 |
| Hero MotoCorp | 1878 |
| General Electric | 1849 |
| Panasonic | 1824 |
| Toyota Motor | 1514 |
| LG Energy Solution | 1508 |
| Schneider Electric | 1495 |
| Dow | 1415 |
| Tata Motors | 1308 |
| Zte Corp | 1292 |
| Euphoric Innovations Pte Ltd | 1281 |
| Mercedes Benz Group | 1273 |
| Vivo | 1241 |
| Maruti Suzuki | 1233 |
| Tata Steel Ltd | 1228 |
| Siemens | 1220 |
| Relaxo Footwears | 1183 |
| Daikin Industries | 1159 |
| Sony Group | 1113 |
| Intel | 1068 |
| Nissan Motor | 1064 |
| Havells | 1047 |
| ABB Group | 1024 |
| Canon | 1020 |
| Unilever Global | 981 |
| Jio Platforms | 970 |
Which Foreign Companies filed most patents in India?
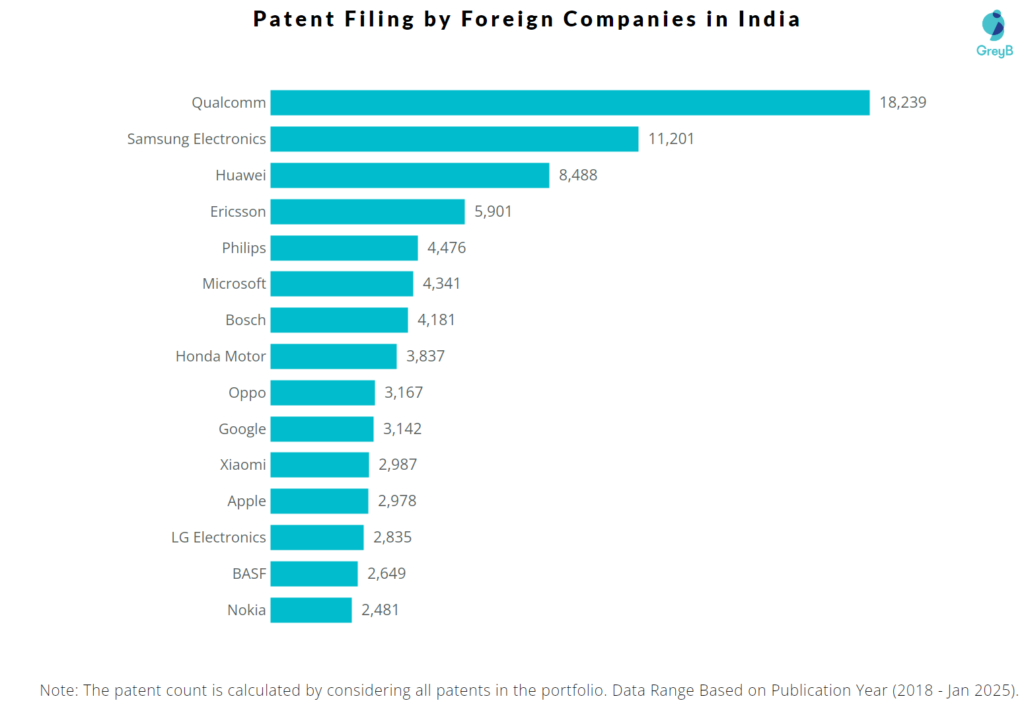
Key Takeaways:
As can be seen from the chart, telecom and electronics industries have contributed the most to the Patent Filing in India.
The chart shows a mix of American (Qualcomm, Microsoft, Apple, Google) and Asian (Samsung, Huawei, Oppo, Xiaomi) companies filing the most patents in India. This indicates India’s appeal as a growth market for both Western and Eastern tech giants.
Qualcomm‘s offices in India focus on wireless modem and multimedia software, as well as DSP and embedded applications and digital media networking solutions.
Samsung has been working on customer-centric innovations for India. A few of their inventions include the Curd Maestro range of refrigerators, allowing customers to create curd at home. Given the fascination with all things curd in Indian households, it’s no surprise that these refrigerators were in high demand across the country.
Huawei India is the company’s largest software development centre outside of China. Big Data, Storage, Handset OS, Artificial Intelligence, Machine Learning, and Cloud Service Development are among the new thrust areas for the smartphone industry in which Huawei is currently working.
Which Indian Companies filed the most patents in India?
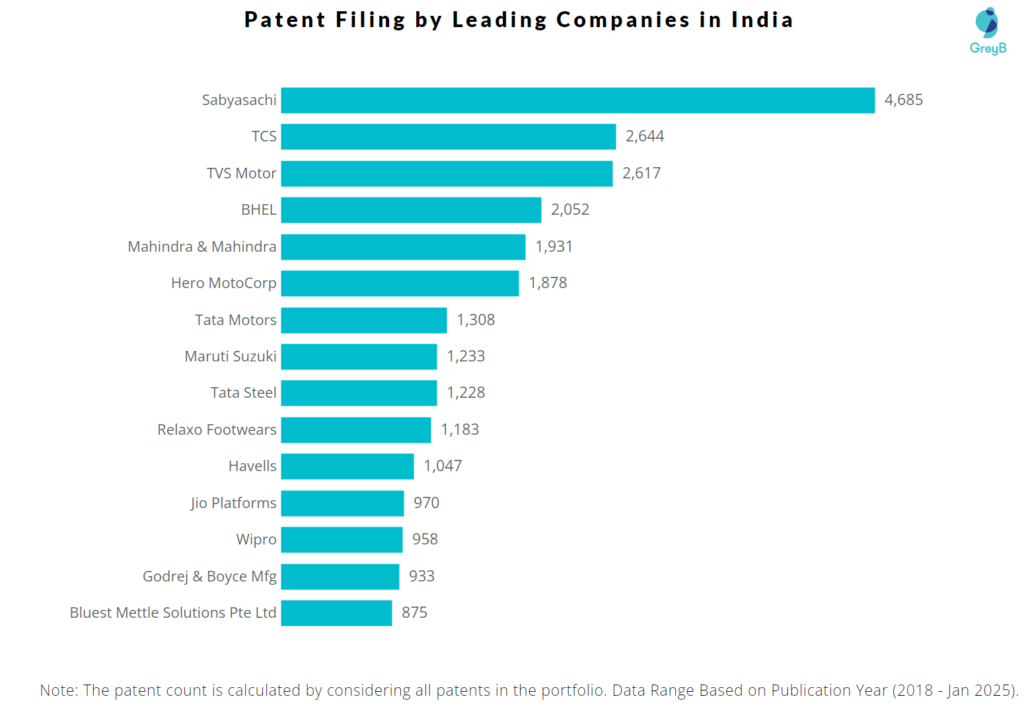
Key Takeaways:
Dominance of Conglomerates and Industrial Powerhouses: The top patent filers in India include major Indian conglomerates and industrial companies such as Sabyasachi, TCS, TVS Motor, BHEL, Mahindra & Mahindra, Tata Motors, Tata Steel, and Relax Footwears. This indicates the breadth of innovative activity across diverse Indian industries.
Prominence of Automotive and Manufacturing Firms: Companies from the automotive and manufacturing sectors, like TVS Motor, Mahindra & Mahindra, Hero MotoCorp, Tata Motors and Maruti Suzuki are among the leading patent filers. This showcases India’s strengths in these traditional industrial sectors.
Presence of IT and Technology Giants: Indian tech giants like TCS, Jio Platforms, and Wipro also feature prominently, reflecting India’s growing capabilities in information technology, software, and digital services.
Sabyasachi (4685 patents), despite being in the fashion and apparel sector, leads the rankings. This indicates a strong focus on innovation in areas such as textile technologies, sustainable materials, or smart apparel solutions, traditionally not known for high patent activity.
TCS‘ intellectual property portfolio covers a diverse range of products and platforms that satisfy the business and technical demands of companies in a variety of industries. The TCS BaNCSTM suite for financial institutions, the TCS ADD platform for the life sciences industry, and a number of additional inventions are among them.
Key Indian Inventors
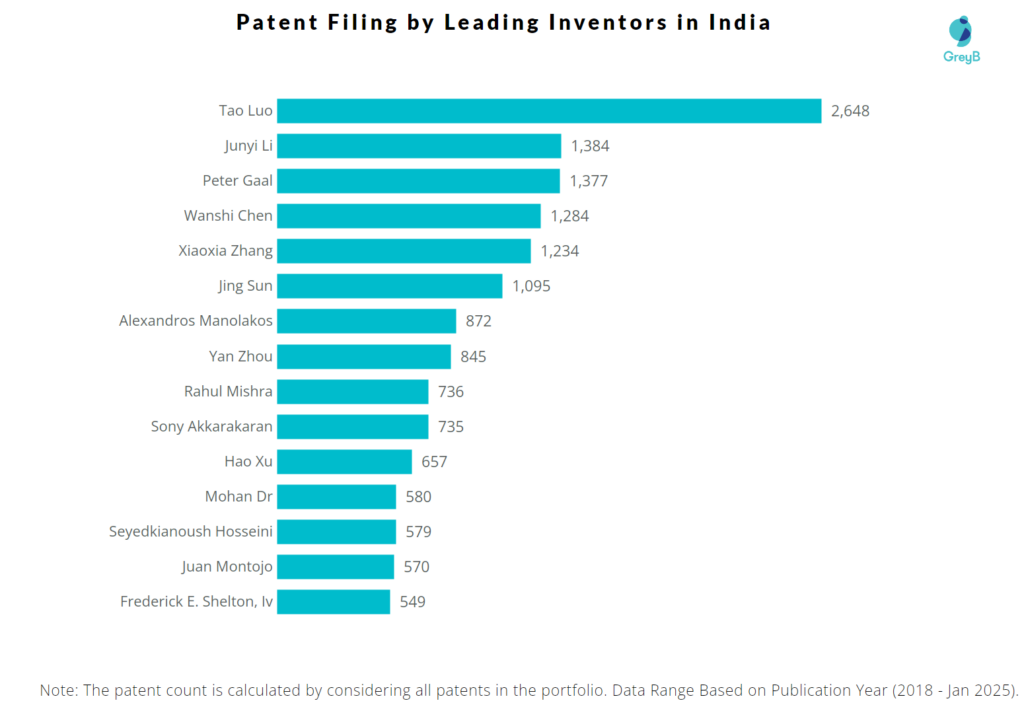
Click here to get a list of the Top 50 Indian Inventors
Which Indian Universities have filed the most patents in India?
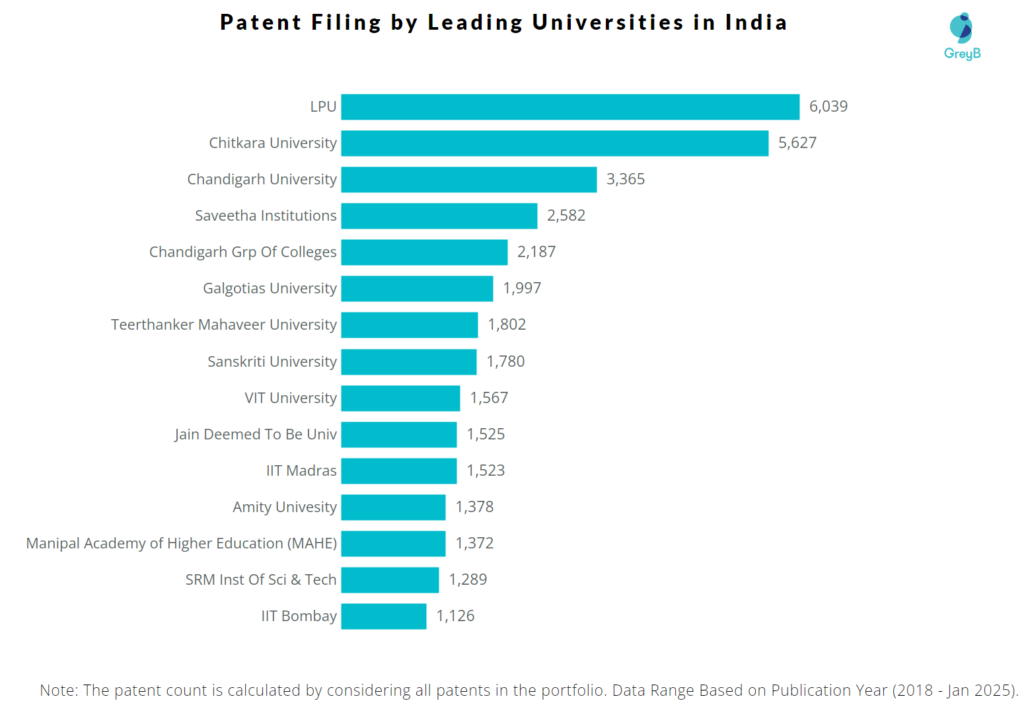
Among the leading Universities and Institutions in India, LPU submitted the most patents. It is concentrating its research efforts on a number of trending areas, including initiatives in the fields of pharmaceutical, medical, computer, Internet of Things, and environmental technology (to name a few).

