
Every year, thousands of European patents are challenged after grant – not through conventional patent litigation, but through the European Patent Office’s opposition procedure. During the nine-month window where anyone can question whether a granted patent should continue to exist in its granted form.
Since 2018, there have been 29,655 oppositions filed on 23,388 patents at the EPO. But not all domains and industries see the same level of challenge. Some sectors face intense scrutiny. Others move through with less contest.
We have previously examined these broader patterns in our analysis of EPO Patent Opposition Trends 2021–2026, which explores how opposition activity has evolved across technologies and industries. We also analyzed the broader competitive landscape in our EPO Opposition analysis, looking at how companies use opposition as a strategic tool against competitors’ patents.
Opposition data shows which companies are defending their ground and which technologies are most disputed. In the Tobacco industry, we identified 1,096 oppositions across 847 patents between January 2018 and July 2026, tracking who files, who opposes, and what happens when these oppositions unfold. So, what does this data mean for you?
Briefly –
- Understanding opposition patterns in the tobacco industry helps you see whether your claim-drafting strategy matches the real chances of a patent surviving. When Smokeless Tobacco Products patents face 44% revocation while Tobacco Packaging face only 22%, your prosecution strategy needs to reflect these realities.
- When opposition activity stabilizes at 140 per year, focused on specific technology sub-domains, your FTO analysis should consider not only granted patents but also how likely those patents are to withstand opposition without being revoked. Opposition filing trends directly affect market entry timing and freedom to operate.
- How does patent drafting strategy change to survive coordinated opposition? Since patents facing 2+ opposers have a higher revocation rate than that compared to single-opposers.
Looking at the data from multiple perspectives helps explain why some companies adopt certain approaches, where those approaches fail, and which opposition strategies are the most effective.
With that, let’s start with breaking down the Opposition data of Tobacco domain into 6 key aspects:
How have opposition filing patterns in the tobacco industry evolved over time?
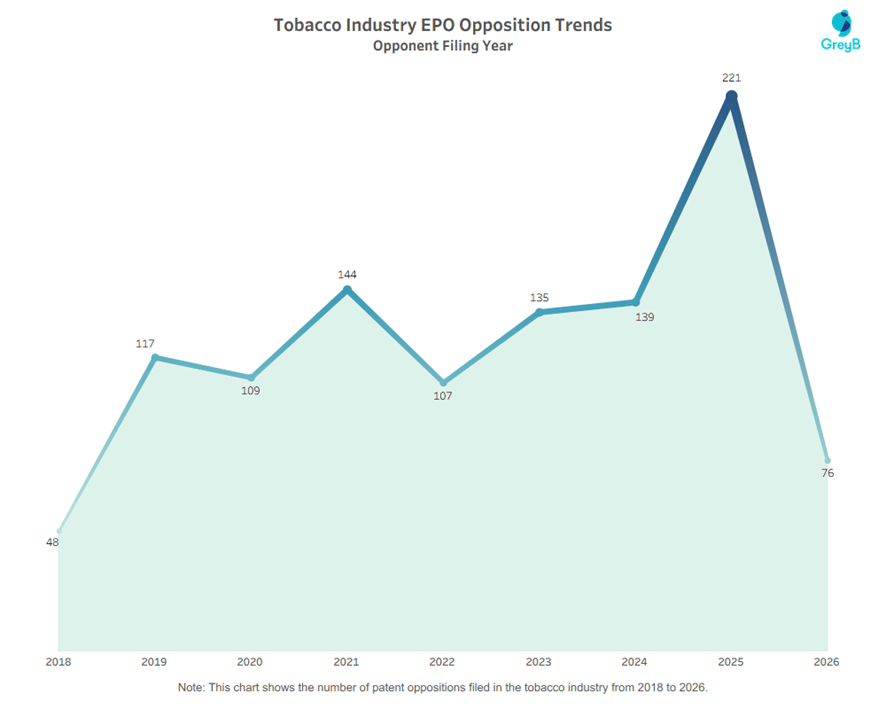
Opposition activity in the tobacco industry has generally moved upward since 2018, although the trend has not been consistent every year.
Filings increased from 48 in 2018 to 144 in 2021, before dropping to 107 in 2022. Activity then picked up again, reaching 135 in 2023, 139 in 2024, and a peak of 221 in 2025. Another 76 oppositions were recorded between January and July 2026.
The sharp rise in 2025 stands out, suggesting that post-grant challenges are becoming a more regular part of competition in the industry.
But the overall filing numbers tell only part of the story. Opposition activity is concentrated in certain tobacco technology sub-domains, which is where the competitive pressure becomes more visible.
Which Tobacco Technologies Are Most Exposed to EPO Opposition?

Opposition activity is not evenly spread across tobacco technologies. E-cigarettes & Vaping Devices account for the highest number of challenged patents at 483, followed by Cigarettes/Cigars with 169 patent records.
This concentration shows where patent boundaries are being tested most frequently. For FTO teams, opposition status can therefore provide an additional signal alongside claim scope, legal status, ownership, and relevant prior art.
Why this matters: If your market entry involves E-cigarettes, Vaping Devices, or Cigarettes/Cigars, should opposition activity become part of your regular patent monitoring? A patent under active challenge may not ultimately survive with the same claim scope in which it was granted.
What are the opposition outcomes in the tobacco industry?
Filing an opposition is one thing. Winning it is another. EPO opposition proceedings result in three possible outcomes: the patent is completely revoked, amended to narrow its scope, or maintained as granted.
These outcomes matter because they reveal how often opposition challenges succeed and how strong patents in this field truly are. In general, a high revocation rate suggests strong prior art arguments from opponents or intense competition in the field, while a high amendment rate indicates that patents may have been granted with overly broad claims.
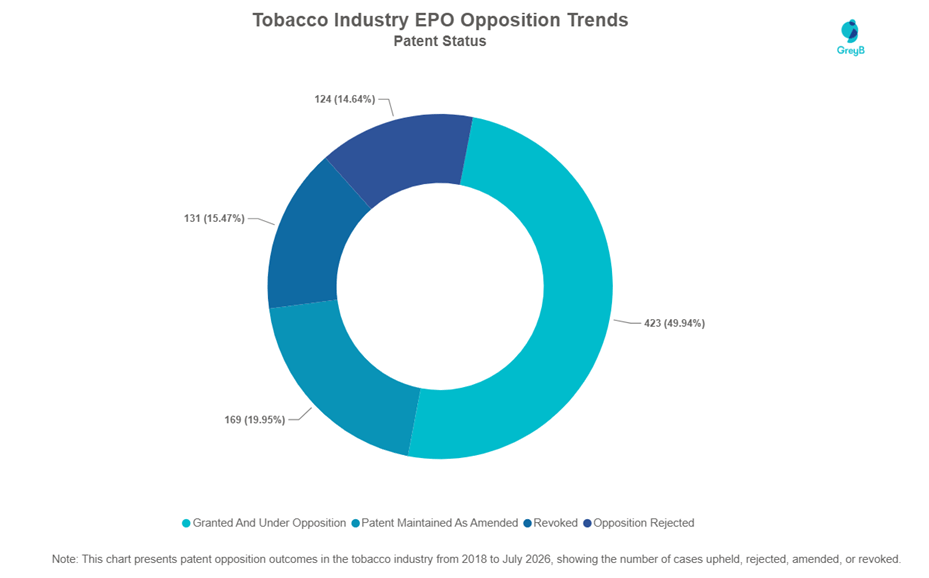
Opposition outcomes in Tobacco industry (2018-2026):
- Patent revoked (successful opposition): 31% of all oppositions
- Patent amended (partly successful): 40% of all oppositions
- Opposition rejected (unsuccessful): 29% of all oppositions
*Percentages calculated by omitting the records which are currently under Opposition
So, what does the 40% amendment rate reveal about current claiming practices? Are patents being filed with broader claims and then narrowed if opposed? And at what point does it make sense to give up some claim scope in order to keep control of the market?
A high amendment rate can indicate that patent owners are willing to accept post-grant narrowing when necessary. Some companies may claim toward the broader boundaries of what the prior art supports, knowing that amendments during opposition remain an option. When a patent protects a core technology that is already part of a commercial product, narrowing the claims may still be a smart move. Even with reduced scope, the patent can continue to protect the specific implementation that matters most.
Why this matters: Opposition does not always end with a patent being completely lost or fully maintained. In many cases, the real outcome is narrower claim scope, which makes strong fall-back positions important during prosecution.
How Have EPO Opposition Outcomes Changed Over Time?
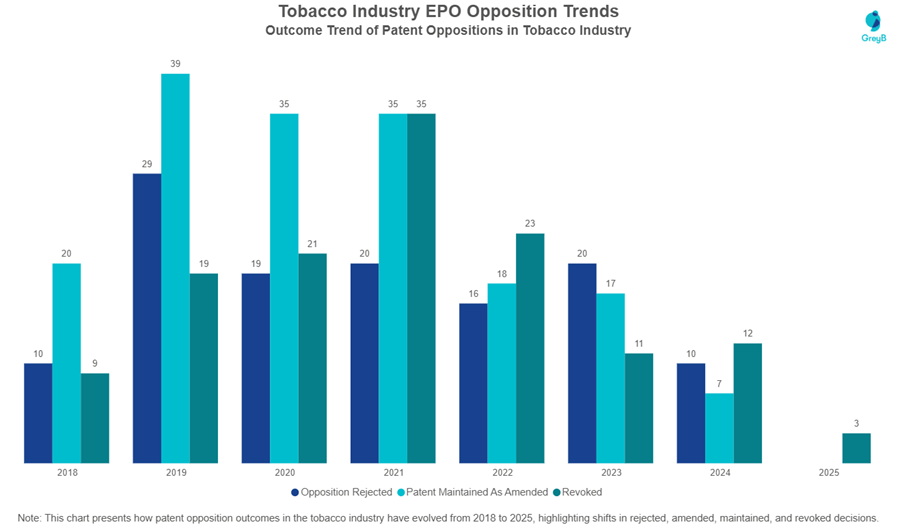
The average revocation rate increased from 24% during 2018 – 2020 to 37% during 2021 -2025. This suggests that challenged patents were more likely to be revoked in the later years.
However, the dataset does not by itself explain why. The increase could be linked to stronger prior-art attacks, differences in the patents being opposed, changes in opponent strategy, or other factors.
EPO Opposition Outcomes by Tobacco Technology Sub-Area:

Opposition outcomes varies significantly across technology sub-areas within Tobacco industry:
- E-cigarettes & Vaping Devices: 35% revocation
- Cigarettes/Cigars: 24% revocation
- Tobacco Manufacturing & Processing: 25% revocation
- Tobacco Packaging: 23% revocation
- Smokeless Tobacco Products: 44% revocation
Not all technology areas see the same outcomes. Patents in E-cigarettes & Vaping Devices, which sees the highest filing, faces revocation in 35% of oppositions, while Smokeless Tobacco Products faces revocation in 44% of oppositions, the highest rate in the industry.
These differences often come down to how much prior art exists in a particular sub-domain. Areas with extensive prior art make it easier to find anticipatory references, but in newer or less explored fields, where prior art is less, patents tend to have a better chance to survive oppositions.
Why this matters: In a sub-domain where a large share of challenged patents either gets revoked or survives only after amendment, dependent claims should do more than incrementally narrow the independent claim. They should preserve fallback positions that continue to cover commercially relevant implementations.
How has the success rate of oppositions in the tobacco industry evolved (Opposer perspective)?
What counts as a “win” can vary depending on each company’s goal. For one opponent, complete revocation may be the objective, while for another, narrowing the claims enough to reduce the patent’s scope may already be a useful outcome.
In this section, we look specifically at how often leading opponents succeed in completely revoking the patents they challenge.
Success rates by top opposition filers (2018 – July 2026):
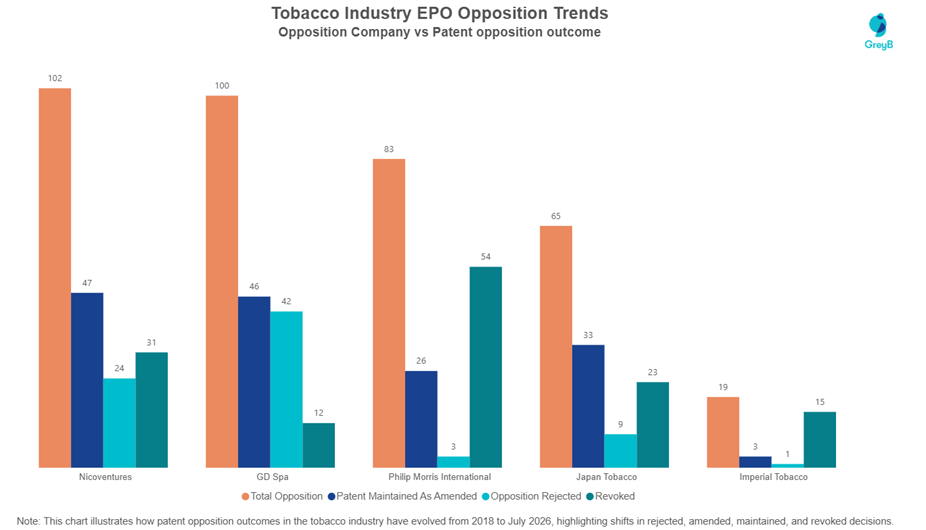
- Nicoventures – 30% success rate across 102 opposition outcomes
- GD Spa -12% success rate across 100 opposition outcomes
- PMI – 65% success rate across 83 oppositions outcomes
- Japan Tobacco – 35% success rate across 65 oppositions outcomes
- Imperial Tobacco – 79% success rate across 19 oppositions outcomes
Nicoventures, the highest opposition filer in this industry, achieves a 30% success rate in completely revoking patents of competitors across 102 opposition outcomes. GD Spa, the second highest opposition filer, achieves a 12% success rate across 100 oppositions.
For context, opponents in the Tobacco industry achieve full revocation in 31% of cases, which sits lower than the EPO average of approximately 47%.
High success rates usually point to one of two things: either companies are selective and only challenge patents with clear weaknesses or they’re exceptionally good at handling oppositions and prior art searches.
Why this matters: PMI succeeds in revoking patents 65% of the time across 83 oppositions. Other top opposers file similar volumes but have a lesser success %.
Is PMI’s high success rate driven by superior prior art searching, or by selective case targeting where they only oppose patents with obvious weaknesses? Either way, their approach is working.
How Often Do Patent Assignees Lose EPO Opposition Cases in the Tobacco Industry (Patent assignee perspective)?
While opposition success rates show how often challengers win, patent-owner losing rates reveal how often assignees fail to defend their granted patents. These metrics are related, but they provide different strategic insights.
A patent owner “loses” when the patent is revoked entirely. Amendments represent a partial loss of scope, as the patent survives but in narrowed form. This section focuses on complete losses – patents that do not survive opposition.
As seen earlier, 31% of concluded Tobacco opposition cases result in complete revocation. From the patent-owner perspective, this means nearly one in three challenged patents are lost entirely.
Losing rates by company:
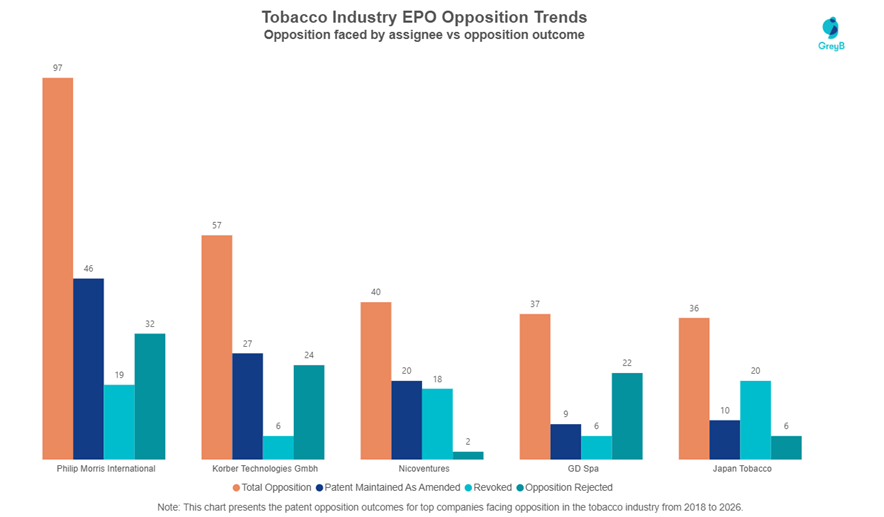
Patent owners show significantly different abilities to defend their patents (based on the opposition proceedings which are declared):
- PMI – 20% losing rate (19 patents revoked out of 97 patents opposed)
- Korber Technologies Gmbh – 11% losing rate (6 patents revoked out of 57 opposed by competitors)
- Nicoventures – 45% losing rate (18 patents revoked out of 40 opposed by competitors)
- GD Spa – 16% losing rate (6 patents revoked out of 37 opposed by competitors)
- Japan Tobacco – 56% losing rate (20 patents revoked out of 36 opposed by competitors)
PMI, Korber Technologies Gmbh and GD Spa demonstrates its ability to defend patents, losing only 11-20% of challenged patents. Their success likely comes from careful claim drafting and thorough prior art clearance during prosecution.
In contrast, Nicoventures and Japan Tobacco lose 45-56% of opposed patents, suggesting aggressive claiming and targeting of fundamental patents by multiple opponents.
All the companies operate in the same technology space, face opposition from the same competitors, and navigate the same EPO procedures. Yet their patents survive at drastically different rates.
Defense success rates:
On the flip side, forming defense strategies around their own patents is a key aspect as well. Below are the stats on these companies ability to reject different opposers:
- PMI – 33% defended (32 patents rejected out of 97 patents opposed)
- Korber Technologies Gmbh – 42% defended (24 patents rejected out of 57 opposed by competitors)
- Nicoventures – 5% defended (2 patents rejected out of 40 opposed by competitors)
- GD Spa – 59% defended (22 patents rejected out of 37 opposed by competitors)
- Japan Tobacco – 17% defended (6 patents rejected out of 36 opposed by competitors)
PMI, Korber Technologies Gmbh and GD Spa defend their granted patents 33-59% of the time, while Nicoventures defends its patents only 5% of the time.
Why this matters: If your prosecution strategy results in patents losing 45-56% of the time, while competitors working on the same technology see loss rates of only 11-20%, the issue might not be the technology or the market. What are companies like PMI, Korber Technologies Gmbh and GD Spa doing differently during prosecution that others can learn from and apply? During prosecution, are you building dependent claims that enable meaningful amendment?
What Happens When Multiple Opposers Challenge the Same Tobacco Patent?
Most patents face opposition. But occasionally, a patent triggers multiple challenges from different competitors, signaling exceptionally high commercial or technical importance.
Multiple oppositions against a single patent can indicate several possible factors. The patent may cover technology that multiple companies need for their products, making it a patent that restricts freedom to operate. It may claim a broad scope that overlaps with many competitors’ activities. Or it may protect a market position that multiple parties want to challenge.
When three, four, or multiple different companies independently decide to oppose the same patent, they’re not just trying to invalidate claims – they’re signaling that this patent, if it survives, restricts technology they all need for their products. It’s a collective vote that this patent shouldn’t grant a single company exclusive control over specific technology.
| Number of Opposers | Revocation rate |
| 1 | 22% |
| 2 | 58% |
| 3 | 79% |
| >4 | 86% |
The outcome patterns for highly opposed patents differ from average opposition outcomes. Patents facing 3+ oppositions are revoked in 88% of cases, compared to a revocation outcome of 22% for patents facing single oppositions.
When patents face multiple oppositions, the proceedings are typically consolidated by the EPO, with all opponents and their evidence considered together. This consolidation means patent holders face combined arguments and prior art from all challengers. This higher revocation rate may suggest that when multiple opponents challenge a patent, the combined weight of evidence proves more persuasive.
Why this matters: If a competitor’s patent attracts multiple oppositions, it may be worth monitoring more closely during FTO analysis. Its granted claim scope may change significantly as the opposition progresses.
Want to know how multiple opposers perform across different technology sub-domains? Reach out to us – this analysis is available on request.
Which Rival Patents Were Most Cited During Oppositions?
Our analysis identifies which companies’ patents are cited most frequently in tobacco opposition proceedings, revealing whose prior art appears most often in these challenges.
Want to know which competitors’ patents are being used most often against others? Reach out to us – this analysis is available on request.
Opposition data offers insights into competitive strategy that simple patent counts can’t show. In the Tobacco industry, the patterns highlight where competition is most intense, which technology areas face greater post-grant pressure, and how differently companies perform when challenging or defending patents.
Opposition proceedings continue to shape the patent landscape by revoking some patents and narrowing others through amendment. Understanding these patterns can support better decisions around filing, challenging, defending, and monitoring patents in this competitive space.
Want insights specific to your technology area, competitor, or portfolio? Reach out to us – we’ll be happy to help.

