
A reassignment study of 1,049 SEP (Standard Essential Patent) records shows a market shaped by a few large portfolio moves, heavy NPE/monetization buying in core wireless technologies, an unusually broad Toyota acquisition pattern, and a separate cluster of transferred patents with prior litigation history.
AT A GLANCE
| 1,049 reassignment records | 1,047 unique publications | 507 records in Apr 2025 | 71.6% acquired by NPE-tagged buyers |
SEP ownership did not move in a steady stream over the last 18 months. It moved in bursts.
The master dataset contains 1,049 reassignment records covering 1,047 unique SEP publication numbers between January 17, 2025 and July 3, 2026. Of those records, 928 fall in 2025 and 121 in 2026 through July 3.
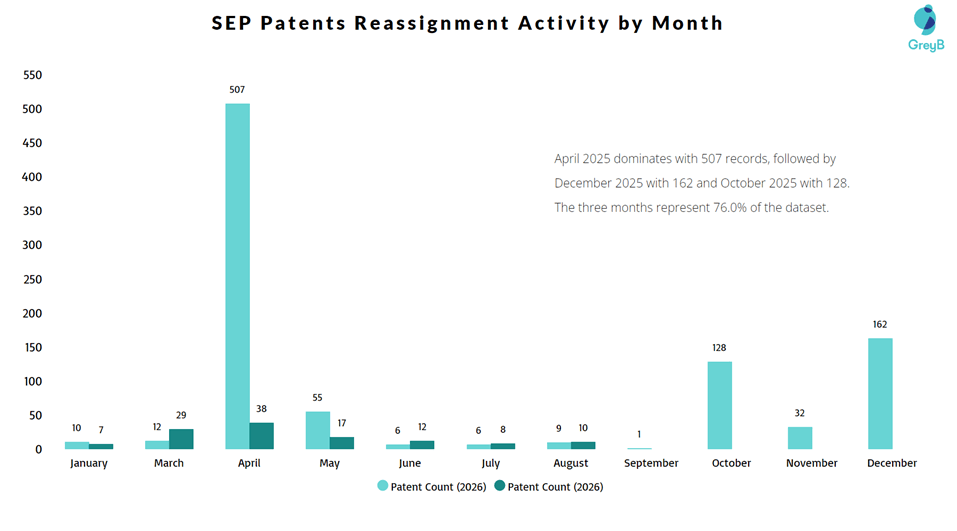
April 2025 was the clear outlier: 507 reassignment records were captured in a single month, close to half of the full dataset. At first glance, that looks like a sudden surge in SEP trading. The transaction-level data tells a different story. Langbo Communication transferred 478 records to Apogee Networks, while BlackBerry transferred another 28 to Malikie Innovations. Together, those two moves explain 506 of April’s 507 records.
That is the first useful signal from the data. The market did not simply “speed up” in April. A small number of large portfolio transfers changed the ownership of hundreds of wireless patents at once. For an IP team, that means the better question is not “How many transfers happened this month?” It is “Which portfolios moved, who now controls them, and which of those patents overlap our products?”
| Treat monthly reassignment volume as an alert, not the conclusion.” This is strong because it changes how the reader interprets the 507-record April spike. |
Three months explain three-quarters of the reassignment activity
April 2025 was the largest month with 507 records. December 2025 followed with 162, and October 2025 with 128. Together, those three months account for 797 records – 76.0% of the entire dataset.
The pattern becomes even clearer when the assignment documents are examined. The 1,049 records are linked to only 83 unique assignment documents, and the ten largest documents account for 74.1% of all records. In other words, much of the apparent “activity” is really a set of portfolio packages rather than hundreds of unrelated buying decisions.
This also helps put 2026 in context. Through July 3, the largest 2026 month is March with 38 records, and activity is more distributed than the large 2025 bursts. Because 2026 is only a partial year in the supplied row-level data, this should not be read as a year-over-year decline. It is simply a reminder that the size and timing of individual deals can dominate the trend line.
The same concentration appears on both sides of the deal
The seller side is led by Langbo Communication with 499 reassignment records, Lenovo with 137, and Ofinno with 125. Together, the top three assignors account for 72.5% of all records.
The buyer side is almost as concentrated. Apogee Networks acquired 489 records, Edgewood IP 151, and Toyota Motor 110. Those three buyers account for 71.5% of the full dataset.
The leading pathways explain why. Langbo to Apogee alone accounts for 489 records across the study period. Lenovo to Edgewood accounts for 137. Ofinno to Toyota contributes 57. Other notable transfers include NEC to Vtect IP, Ofinno to Bloomsbury Design Labs, Conversant Wireless Licensing to MediaTek, BlackBerry to Malikie Innovations, and Sony to Toyota.
This is a more useful way to read the market than a simple ranking of buyers and sellers. The important unit of analysis is often the pathway: who transferred the portfolio, who received it, and whether the ownership change alters the commercial context around those patents.
Top 25 Patent Assignors
| Sr.No. | Assignor | Patents | Industry |
| 1 | Langbo Communication | 499 | Telecommunications |
| 2 | Lenovo | 137 | Computer Hardware & Consumer Electronics |
| 3 | Ofinno Llc | 125 | Telecommunications R&D / Wireless Technology |
| 4 | NEC | 54 | Information Technology & Telecommunications |
| 5 | Conversant Wireless Licensing Ltd | 32 | Patent Licensing & IP Management |
| 6 | Blackberry | 28 | Enterprise Software & Cybersecurity |
| 7 | Sony | 27 | Consumer Electronics & Entertainment |
| 8 | Oppo | 24 | Consumer Electronics |
| 9 | Huawei | 20 | Telecommunications & ICT |
| 10 | Vivo | 18 | Consumer Electronics |
| 11 | LG | 16 | Consumer Electronics |
| 12 | Dataa Robotics Anji Co Ltd | 13 | Robotics & Artificial Intelligence |
| 13 | Lepatent Beijing Consulting | 10 | Patent Licensing & IP Management |
| 14 | Nokia | 7 | Telecommunications |
| 15 | Parsa Wireless Communications Llc | 6 | Telecommunications |
| 16 | Xiaomi | 6 | Consumer Electronics |
| 17 | Ultraleap Ltd | 5 | Spatial Computing / Haptics Technology |
| 18 | Motorola Mobility | 4 | Consumer Electronics |
| 19 | Wistron Corp | 4 | Electronics Manufacturing Services / ODM |
| 20 | Cadence Design Systems Inc | 2 | Electronic Design Automation (EDA) Software |
| 21 | KT Corporation | 2 | Telecommunications |
| 22 | Sandisk Technologies | 2 | Data Storage & Semiconductor Memory |
| 23 | Daedalus Prime Llc | 2 | Patent Licensing & IP Monetization |
| 24 | Arzeltech Sas | 1 | Telecommunications Consulting & R&D |
| 25 | Deutsche Telekom | 1 | Telecommunications |
Top 25 Patent Acquirer
| Sr.No. | Assignee | Patents | Industry |
| 1 | Apogee Networks Llc | 489 | Patent Licensing & IP Management |
| 2 | Edgewood Ip Llc | 151 | Patent Licensing & IP Management |
| 3 | Toyota Motor | 110 | Automotive |
| 4 | Philips | 60 | Health Technology & Consumer Electronics |
| 5 | Vtect IP Inc | 47 | Patent Licensing & IP Management |
| 6 | Bloomsbury Design Labs Llc | 37 | Patent Licensing & IP Management |
| 7 | Mediatek | 34 | Semiconductors |
| 8 | Malikie Innovations | 28 | Patent Licensing & IP Management |
| 9 | Xingjie Shuxing Technology | 13 | Patent Licensing & IP Management |
| 10 | Interdigital | 11 | Telecommunications R&D & Patent Licensing |
| 11 | Bunker Hill Technologies Llc | 10 | Patent Licensing & IP Management |
| 12 | Jvckenwood | 7 | Electronics & Communications Equipment |
| 13 | 5G Golf Cars Llc | 6 | Patent Licensing & IP Management |
| 14 | Oriental IP Investment | 6 | Patent Licensing & IP Investment |
| 15 | Panasonic | 5 | Consumer Electronics |
| 16 | Sim Ip Hxr Llc | 5 | Patent Licensing & IP Management |
| 17 | Dolby | 5 | Audio & Video Technology |
| 18 | Resmed | 5 | Medical Devices & Digital Health |
| 19 | Mammoth Licensing | 4 | Patent Licensing & IP Management |
| 20 | NEC | 4 | Information Technology & Telecommunications |
| 21 | Volkswagen | 3 | Automotive |
| 22 | Palisade Technologies | 2 | Patent Licensing & IP Management |
| 23 | Silvaco Inc | 2 | EDA Software & Semiconductor Technology |
| 24 | Value Innovation Partners | 2 | Patent Licensing & IP Management |
| 25 | The Walt Disney | 1 | Media & Entertainment |
The bigger ownership shift: 7 in 10 records moved to NPE/monetization-tagged buyers
The buyer mix is where the reassignment data becomes more actionable.
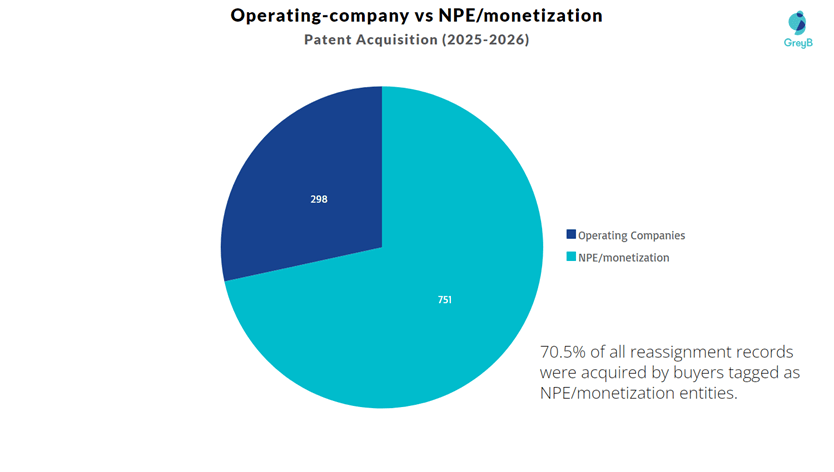
Using the entity classifications supplied in the dataset, 12 of the 27 acquirers are tagged as NPE/monetization entities. Those 12 buyers acquired 740 records, or 70.5% of the dataset, moved from an operating-company-tagged assignor to an NPE/monetization-tagged acquirer.
That does not mean the shift is broad-based across all NPEs. It is highly concentrated. Apogee Networks acquired 489 of the NPE-bound records and Edgewood IP acquired 151. Together, the two account for 640 of 751 NPE-acquired records – about 85.2%.
This distinction matters. Saying “13 NPEs acquired SEP patents” describes the participants. Saying “more than 70% of the reassignment volume went to NPE/monetization-tagged buyers, and 85% of that NPE volume is concentrated in two entities” describes the exposure pattern.
| Actionable Takeaway Prioritizing Apogee and Edgewood by portfolio scale/product relevance is decision-useful. |
What moved with the ownership? Core wireless functions, not just peripheral patents
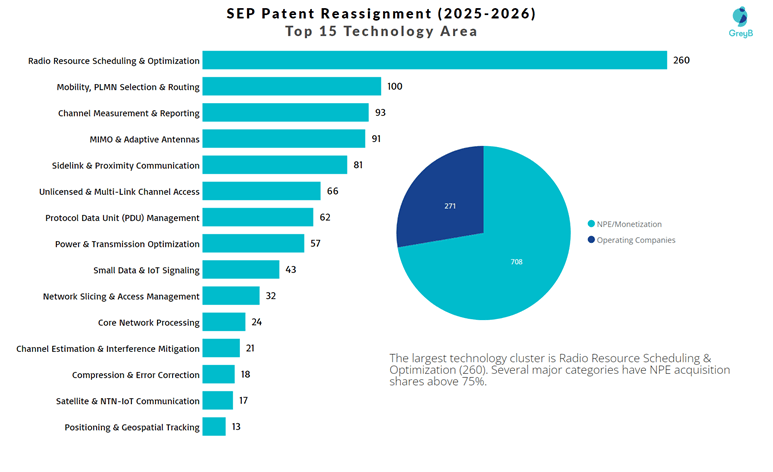
The technology mix gives the ownership data context. Radio Resource Scheduling & Optimization is the largest refined technology area with 260 records. It is followed by Mobility, PLMN Selection & Routing with 100, Channel Measurement & Reporting with 93, MIMO & Adaptive Antennas with 91, Sidelink & Proximity Communication with 82, and Unlicensed & Multi-Link Channel Access with 66.
Those categories sit close to the way wireless devices and networks allocate resources, measure channels, manage mobility, coordinate links and maintain connectivity. So the practical question is not only which technology bucket is largest. It is who now owns meaningful blocks of patents in the technologies most likely to intersect a company’s products.
When buyer type is overlaid on the technology data, several of the larger categories show a strong NPE/monetization share: 83.3% of Unlicensed & Multi-Link Channel Access records, 82.4% of MIMO & Adaptive Antennas, 78.9% of Power & Transmission Optimization, 78.1% of Network Slicing & Access Management, 76.3% of Channel Measurement & Reporting, and 75.0% of Radio Resource Scheduling & Optimization.
Again, the concentration needs to be kept in view. Apogee is the largest buyer in several of those categories, while Edgewood contributes another large block. The signal is therefore not that every patent in these technologies is moving to an NPE. The signal is that a few monetization-focused portfolios now hold a large share of the recently transferred assets in several core wireless functions.
| Actionable Takeaway Prioritize by overlap, not raw patent count.” This is probably the strongest R&D/IP takeaway because you even differentiate connected-car versus chipset priorities. |
The buyers are not all doing the same thing – and they should not be monitored the same way
Apogee, Edgewood, Toyota, Philips and MediaTek are not a conventional competitor set. Comparing their products would add little. Comparing how they acquired SEP assets is much more useful, because the acquisition pattern tells an IP team what question to ask next.
| Acquirer | Count | Sellers | Portfolio pattern | What to investigate next |
| Apogee Networks | 489 | 1 | Large single-source build: all 489 records came from Langbo. 478 arrived in April 2025. | Technology concentration, family strength, post-acquisition licensing/assignment activity, and product overlap. |
| Edgewood IP | 151 | 3 | Portfolio led by 137 Lenovo records, with additional assets from Lepatent and Motorola Mobility. | How the Lenovo-heavy portfolio maps to product-relevant wireless functions and whether further aggregation continues. |
| Toyota Motor | 110 | 7 | Multi-source acquisition pattern across 28 assignment documents and 18 refined technology areas. | Which technology clusters align with connected mobility, sidelink, scheduling, positioning or adjacent vehicle connectivity needs. |
| Philips | 60 | 3 | Wireless assets sourced from Ofinno, Vivo and Huawei across six months. | Whether the transferred portfolio strengthens connectivity positions relevant to connected health and device businesses. |
| MediaTek | 34 | 2 | 32 records came from Conversant Wireless Licensing; nine of those patents have prior litigation history. | Past claim use, family status and product relevance of the historically asserted Conversant patents. |
Toyota is the clearest operating-company outlier in the dataset
The NPE story explains most of the transferred volume, but Toyota shows a different kind of signal.
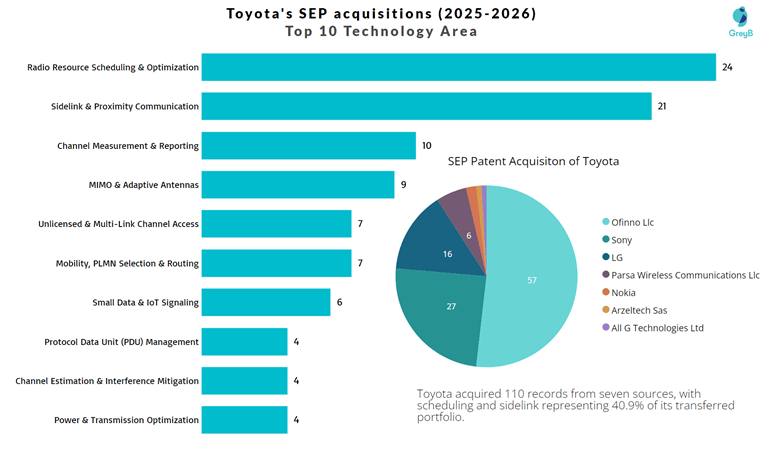
Toyota acquired 110 reassignment records from seven different assignors: Ofinno (57), Sony (27), LG (16), Parsa Wireless Communications (6), Nokia (2), All G Technologies (1), and Arzeltech (1). Those acquisitions span 28 assignment documents and five months.
That makes Toyota materially different from a buyer such as Apogee, whose 489-record position comes from a single source. Toyota’s transferred portfolio was assembled from multiple owners, and it is spread across 18 refined technology areas.
The largest Toyota technology groups are Radio Resource Scheduling & Optimization with 24 records and Sidelink & Proximity Communication with 21. Together, those two areas account for 40.9% of Toyota’s acquired records. Channel Measurement & Reporting adds another 10, and MIMO & Adaptive Antennas another 9.
The data does not tell us why Toyota acquired these patents, so it would be a mistake to label the portfolio as defensive, licensing-led or tied to a specific product program. What it does show is enough to justify a closer look: an automotive operating company accumulated a meaningful wireless SEP position from seven sources rather than receiving one isolated portfolio block.
A five-patent UAV cluster is small – but it shows why outliers can matter
Only five records in the dataset are classified under UAV & Aerial Network Management. Two moved from Sony to Toyota, two moved from Dataa Robotics Anji to Xingjie Shuxing Technology, and one Lenovo record moved to Edgewood IP.
Five records are not enough to call this a broader acquisition trend. The value is in the outlier itself. When a buyer is already building a larger wireless portfolio, a small cluster in an adjacent application can help identify where a manual review may reveal something that a top-technology chart would hide.
Litigation history tells a different story from the NPE data
The litigation overlay is where the analysis becomes more useful – and where a simple “NPE means litigation risk” narrative breaks down.
Ten transferred patents in the supplied litigation file have prior litigation history. Nine of those ten are now with MediaTek, an operating company in the provided entity tagging. Only one – US8625506B2, transferred from BlackBerry to Malikie Innovations – is now with an acquirer tagged as NPE/monetization.
The nine MediaTek patents came from a 32-record Conversant Wireless Licensing transfer in May 2025. That means 28.1% of that transferred package has an identified litigation history in the supplied file. Across the ten patents, the dataset records 24 historical case instances.
Three patents stand out for repeated use in past disputes: US7782818B2 with seven recorded cases, US7804850B2 with five, and US7529271B2 with four. Five of the ten litigated patents were previously involved in cases naming Tesla as a defendant; all five are now in the MediaTek portfolio.
None of that proves future assertion. What it does provide is a better priority order. A patent with a litigation record comes with more history to examine: which claims were used, which technical features were targeted, which validity arguments were raised, what happened in the case, and what related family members remain active.
Four transferred patents worth putting at the front of the diligence queue
| Patent | Prior case count | Current acquirer | Technology | Why it matters |
| US7782818B2 | 7 | MediaTek | Core Network Processing | Highest case count in the litigation file. Past disputes involved Apple and LG, giving a richer record for claim-use and family review. |
| US7804850B2 | 5 | MediaTek | Radio Resource Scheduling & Optimization | Repeated litigation plus placement in the largest transferred technology category makes it a high-priority technical and legal review candidate. |
| US7529271B2 | 4 | MediaTek | PDU Management | Multiple historical cases involving Apple/LG. Review asserted claims, surviving family members and relevance to current implementations. |
| US8625506B2 | 1 | Malikie Innovations | PDU Management | The only litigated patent in the supplied set now held by an NPE/monetization-tagged buyer, making it a distinct ownership-plus-history watch item. |
| Actionable Takeaway Separating enforcement-history screening from NPE screening is central to your article’s differentiated insight. |
The direction you already have – “Need to know which of these transferred SEPs matter to your products?” – is good. It follows naturally from the entire article because your analysis repeatedly says that reassignment is an early-warning signal, not the final risk conclusion.
From reassignment data to an actionable SEP watch list
The 1,049 reassignment records are more useful as early-warning signals than as a single risk score.
Different ownership patterns point to different follow-up questions, making three watchlists more practical.
| Trigger to watch | Watchlist | What to investigate next |
| An NPE is accumulating patents in the same technology cluster | Monetization | Which active families remain, and how closely do their claims map to standards or products? |
| Transferred patents already carry litigation or assertion history | Enforcement history | Are the asserted claims or related active family members still relevant to current products? |
| An operating company is buying from multiple sellers or entering unfamiliar technology areas | Competitive portfolio building | Is the buyer strengthening an existing position or building capability in a new market? |
1. Monetization watchlist
Apogee and Edgewood are the first screens because of the scale of their NPE/monetization-tagged acquisitions. The next step is to determine whether the transferred families remain active and map to commercially relevant standards or products.
2. Enforcement-history watchlist
The MediaTek/Conversant portfolio stands out because nine transferred patents already have a litigation record. These assets warrant closer review of previous assertions, active family members, and current product relevance.
3. Competitive portfolio-building watchlist
Toyota’s acquisitions span seven sellers and 18 technology areas, making them useful for tracking broader portfolio-building activity. Smaller but unusual technology clusters, including UAV-related assets, may also reveal new areas of strategic interest.
When a trigger appears, go deeper
Reassignment data tells you where to investigate, not whether actual exposure exists. A deeper review can assess legal status, remaining patent life, claim-to-standard mapping, product relevance, and enforcement history.
Want to assess a specific assignee, SEP portfolio, or technology area? Share it with us for a focused review of the patents and risks behind the ownership change.
What this means for IP, R&D and business teams
For IP and licensing teams, the main value of reassignment data is early prioritization. A large transfer can change the counterparty landscape before a licensing discussion or assertion ever reaches the public stage.
For R&D teams, the technology overlay helps narrow the problem. Instead of reviewing every transferred SEP, they can focus on the functions closest to current and planned implementations – scheduling, sidelink, MIMO, channel measurement, mobility, power optimization or other relevant areas.
For competitive intelligence teams, the buyer pattern can reveal companies building positions outside the most obvious peer set. Toyota is the clearest example in this dataset: its 110 records are not large because of one inherited portfolio alone; they were assembled from seven different sources.
For business leaders, the practical message is simpler: ownership changes can alter who has leverage around technology your products already use. The useful signal is therefore not “a patent was reassigned.” It is “this portfolio moved to this buyer, in this technology, with this history – does that change what we need to watch?”
Need to know which of these transferred SEPs matter to your products?
| Reassignment data is the starting point, not the risk conclusion. A deeper review can connect the new owner with claim-to-standard mapping, product overlap, patent-family relationships, remaining term and legal status, prior litigation, and subsequent activity by the acquirer. This analysis uses reassignment records received/recorded through July 3, 2026. For an updated view of recent SEP ownership changes – or to identify which transferred portfolios create the highest relevance for a specific company, product or technology area – request a tailored reassignment and portfolio-risk analysis. |
The non-obvious takeaway: the biggest NPE signal and the biggest litigation signal are not the same portfolio
The headline number is more than 1,000 SEP reassignment records. But that is not the most useful conclusion from the study.
The reassignment flow is heavily concentrated: three months account for 76% of activity, and a handful of large assignor-to-assignee pathways explain much of the movement. More than 70% of records moved to NPE/monetization-tagged buyers, but most of that volume is concentrated in Apogee and Edgewood. At the same time, the strongest historical litigation cluster sits elsewhere: nine of the ten previously litigated patents are now with MediaTek.
Toyota adds a third pattern altogether – a multi-source operating-company acquisition spread across wireless technologies, including a small UAV-related cluster.
That separation is the real strategic signal. NPE ownership, litigation history and competitive portfolio building should not be collapsed into one generic “SEP risk” bucket. They are different reasons to look closer, and they call for different follow-up questions.
For teams monitoring standards-related patents, reassignment data works best as an early-warning layer. It tells you where ownership has changed. The next step is to decide which of those changes actually alters your licensing, litigation or competitive exposure.
Methodology and data note
This analysis covers ETSI-declared SEP reassignment records received/recorded in 2025 and 2026, with dates in the supplied dataset ranging from January 17, 2025 to July 3, 2026. The Final sheet contains 1,049 reassignment records covering 1,047 unique publication numbers. Two publications appear in two assignment records because separate assignor interests were recorded as transferring to Toyota.
The assignment received/recorded date is used to define the analysis period and should not be interpreted as the original execution date of every transfer. 2026 data is year-to-date through July 3, 2026, rather than a full-year dataset.
Entity classifications such as Operating Company and NPE/Monetization follow the tagging provided in the source dataset and were not independently reclassified. Litigation-history observations are drawn from the separate litigation-history workbook. Unless otherwise stated, counts and percentages in the article are calculated from the 1,049 row-level reassignment records, rather than from reduplicated publication numbers.